← Project 14

PROJECT 14 / SUPPORTS & JOINTS

Counters, shelves and a hood surround
Support examples

These examples calculate forces from selected drawing outlines. Supports and extra loads are assumed so the options can be compared.

Preliminary design scenarios · strength verification pending

Support positions, load cases, fixings and joint details were not supplied. The following examples are created for comparison; they do not establish that any completed job or proposed installation is safe.

Structural options for this project.

Cabinet perimeter + local rails

A continuous, level cabinet frame carries the top. Add independently supported rails at seams and fixture openings after the cabinet layout is confirmed.

Requires cabinet bearing lines, cutout templates and local manufacturer guidance.

Independent frame or legs

A frame beneath an island, desk or seating surface can transfer loads directly to legs and the floor, reducing dependence on a stone seam.

Frame member bending, deflection, connections, stability and floor capacity still need design.

Concealed bracket option

For an open edge, compare a bracketed bay with a floor-tied knee wall or structurally reinforced cabinet. The Liberty example below illustrates one product’s conditions.

Actual overhang, tip setback, blocking, anchors and slab-specific limits are unverified.

Panel ledger + lateral restraints

For vertical faces, a bottom ledger can carry gravity while separate restraints resist out-of-plane movement. A framed backing system is another option.

Verify panel orientation, substrate, anchors, eccentricity, movement and any appliance heat clearances.

Seat or shelf on a separate frame

A seat can use a frame or legs designed for the intended occupancy; a shelf can use rated supports into verified framing.

The example 500 N load is not an occupancy rating. Establish the actual concentrated and impact load case before sizing.

Hood surround on an independent backing frame

Treat elevated stone faces as cladding attached to a designed support system, independent of decorative stone-to-stone bonds.

Check falling-object restraint, heat exposure, appliance clearances and the wall or ceiling connection.

What each piece asks its supports to carry.

Results are per physical piece; quantities are shown separately. Alternative drawing sheets are not added together. Horizontal surface examples add an illustrative 500 N point load to stone self-weight; trim strips and vertical panels use self-weight only.

Component / sourceThickness basisScenario mass / gravitySupport demandStrength check
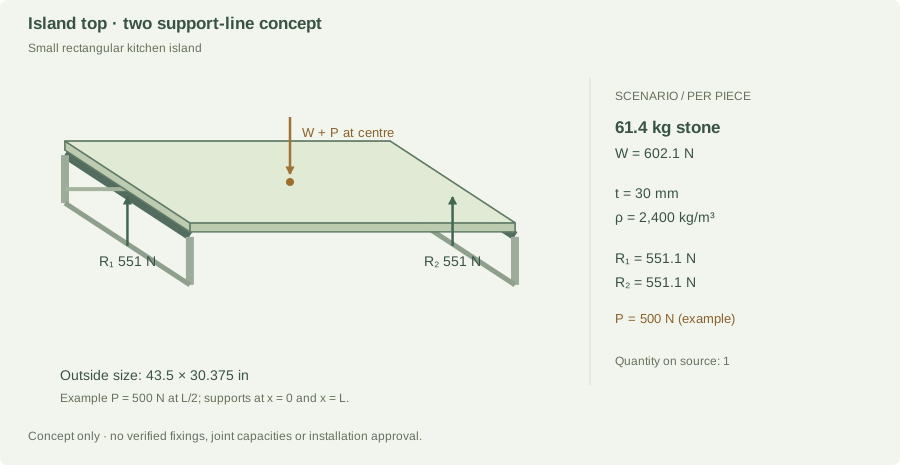
Small rectangular kitchen islandproject-14a.jpg · qty 1; results per piece30 mmdrawing reading61.4 kg602.1 N self-weightR₁ 551.1 N
R₂ 551.1 N
UnverifiedDemand only; resistance not established
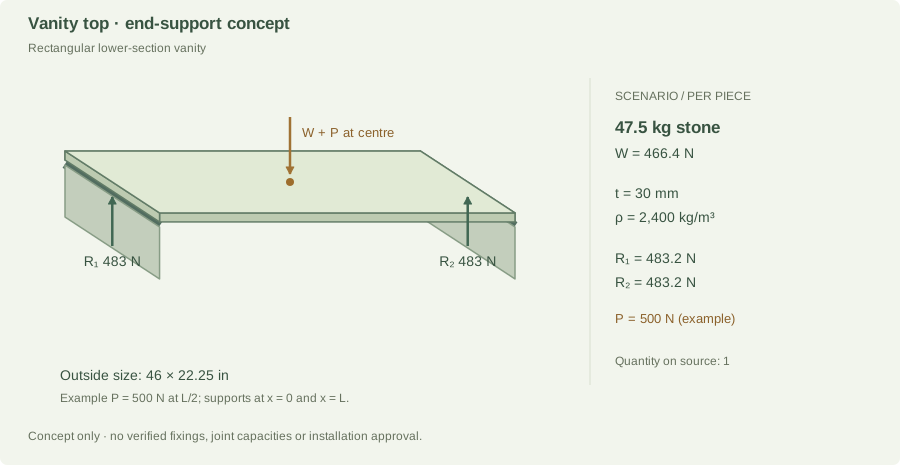
Rectangular lower-section vanityproject-14a.jpg · qty 1; results per piece30 mmdrawing reading47.5 kg466.4 N self-weightR₁ 483.2 N
R₂ 483.2 N
UnverifiedDemand only; resistance not established
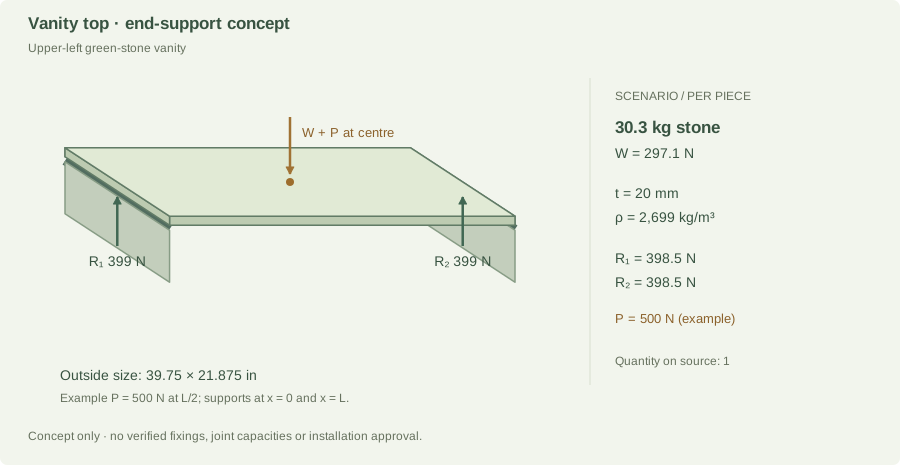
Upper-left green-stone vanityproject-14a.jpg · qty 1; results per piece20 mmdrawing reading30.3 kg297.1 N self-weightR₁ 398.5 N
R₂ 398.5 N
UnverifiedDemand only; resistance not established
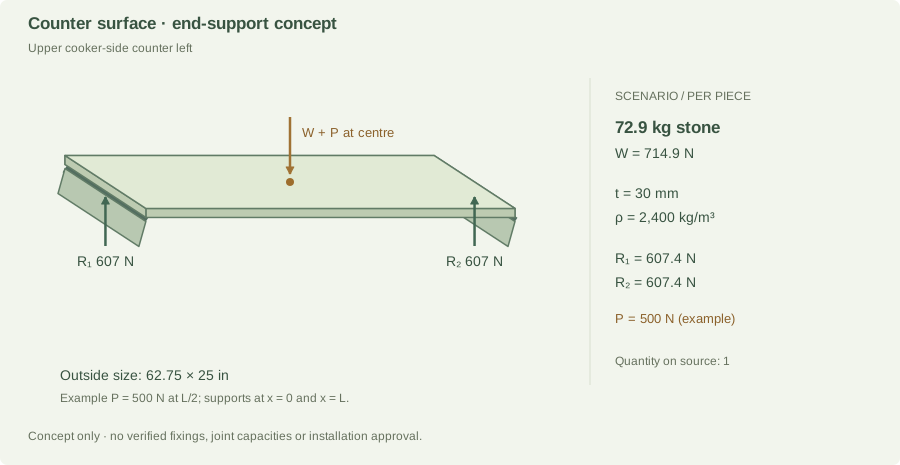
Upper cooker-side counter leftproject-14b.jpg · qty 1; results per piece30 mmdrawing reading72.9 kg714.9 N self-weightR₁ 607.4 N
R₂ 607.4 N
UnverifiedDemand only; resistance not established
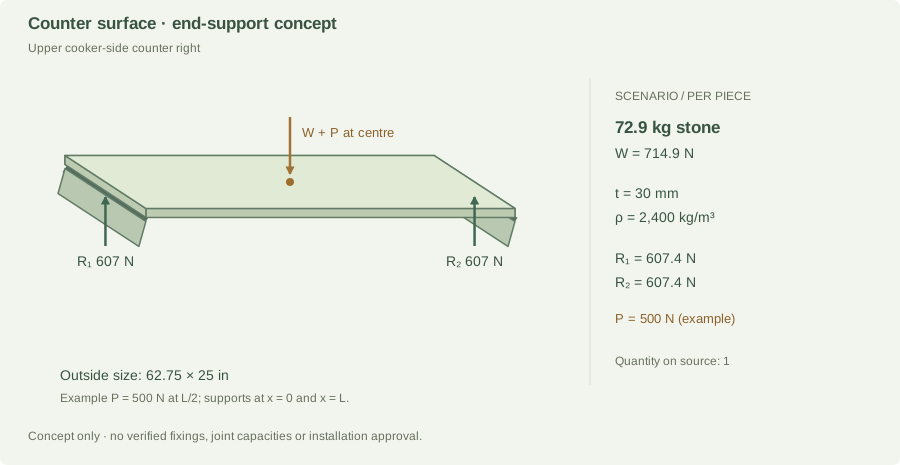
Upper cooker-side counter rightproject-14b.jpg · qty 1; results per piece30 mmdrawing reading72.9 kg714.9 N self-weightR₁ 607.4 N
R₂ 607.4 N
UnverifiedDemand only; resistance not established
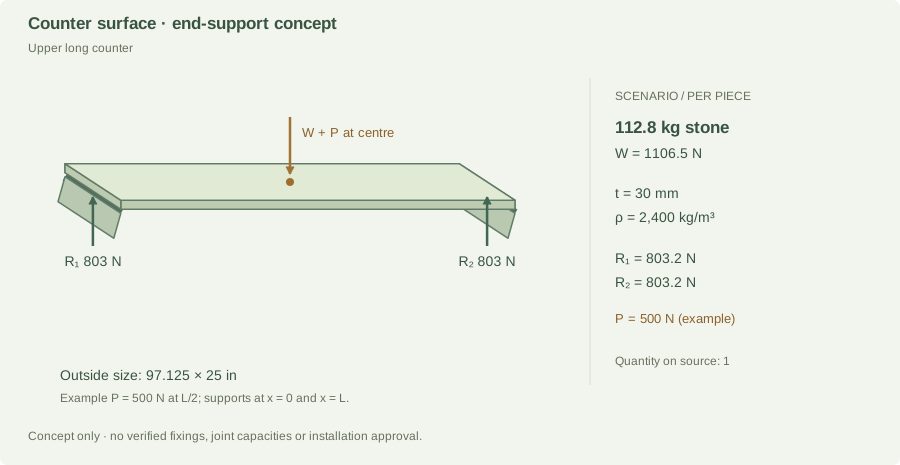
Upper long counterproject-14b.jpg · qty 1; results per piece30 mmdrawing reading112.8 kg1,106.5 N self-weightR₁ 803.2 N
R₂ 803.2 N
UnverifiedDemand only; resistance not established
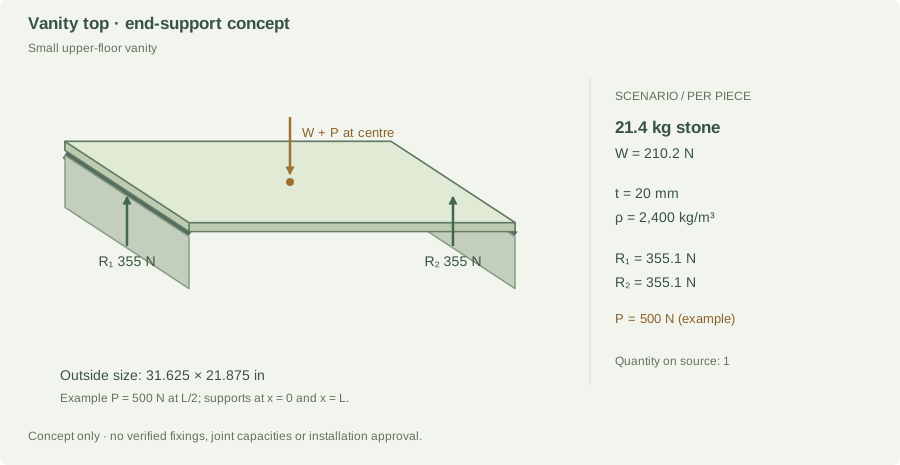
Small upper-floor vanityproject-14b.jpg · qty 1; results per piece20 mmdrawing reading21.4 kg210.2 N self-weightR₁ 355.1 N
R₂ 355.1 N
UnverifiedDemand only; resistance not established
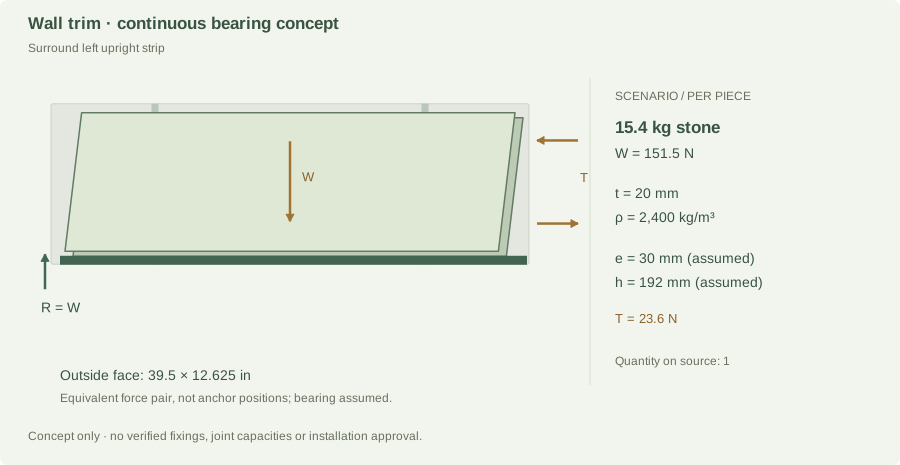
Surround left upright stripproject-14b.jpg · qty 1; results per piece20 mmdrawing reading15.4 kg151.5 N self-weightLedger 151.5 N
Restraint couple 23.6 N
UnverifiedDemand only; resistance not established
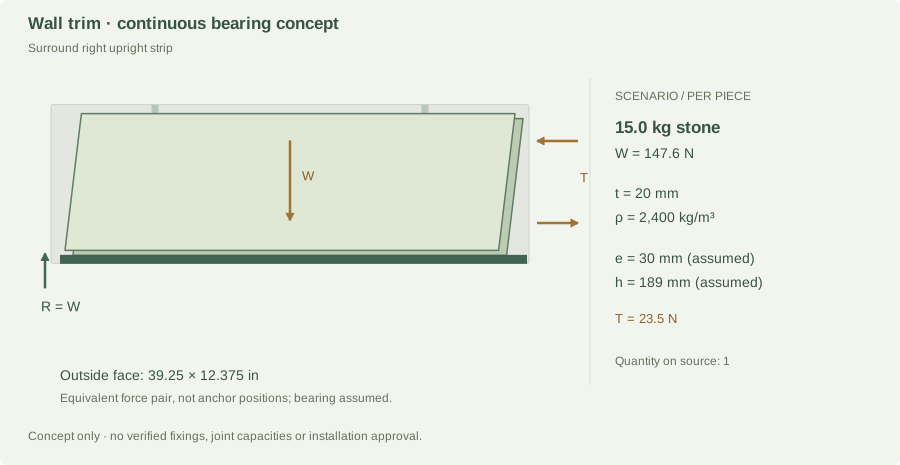
Surround right upright stripproject-14b.jpg · qty 1; results per piece20 mmdrawing reading15.0 kg147.6 N self-weightLedger 147.6 N
Restraint couple 23.5 N
UnverifiedDemand only; resistance not established
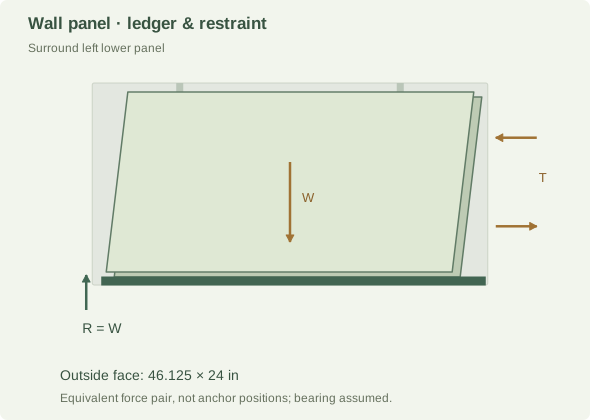
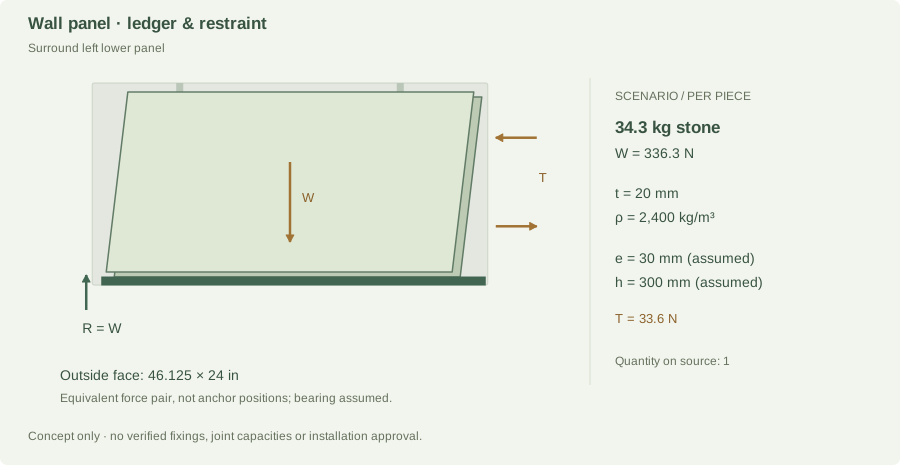
Surround left lower panelproject-14b.jpg · qty 1; results per piece20 mmdrawing reading34.3 kg336.3 N self-weightLedger 336.3 N
Restraint couple 33.6 N
UnverifiedDemand only; resistance not established
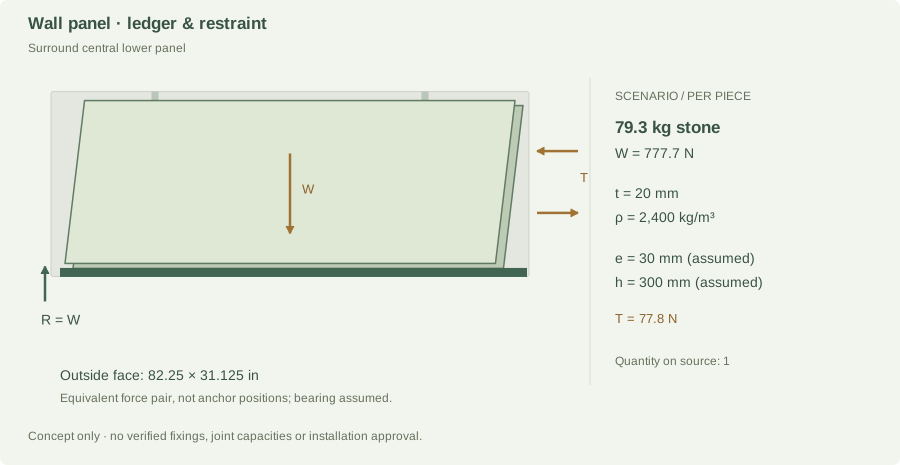
Surround central lower panelproject-14b.jpg · qty 1; results per piece20 mmdrawing reading79.3 kg777.7 N self-weightLedger 777.7 N
Restraint couple 77.8 N
UnverifiedDemand only; resistance not established
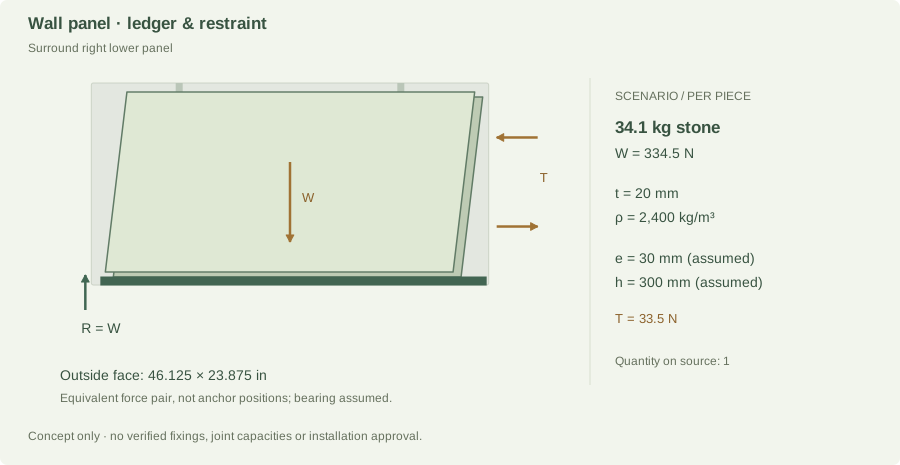
Surround right lower panelproject-14b.jpg · qty 1; results per piece20 mmdrawing reading34.1 kg334.5 N self-weightLedger 334.5 N
Restraint couple 33.5 N
UnverifiedDemand only; resistance not established
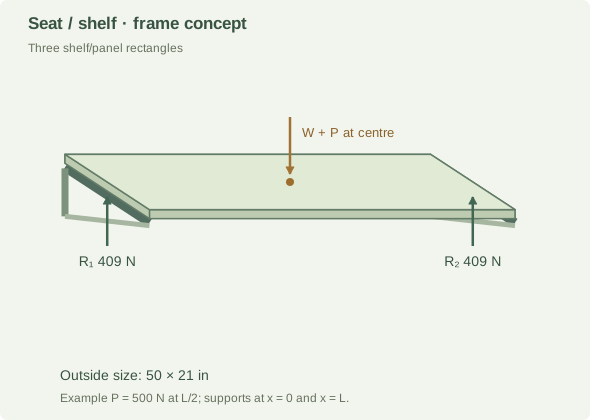
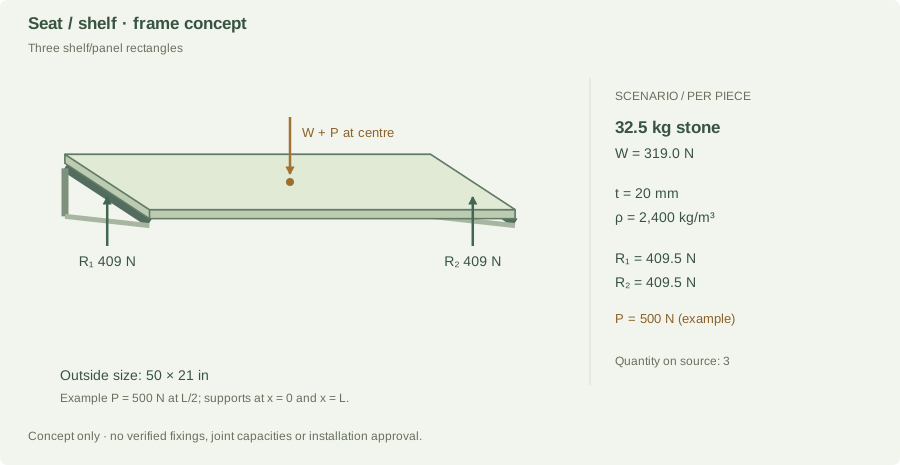
Three shelf/panel rectanglesproject-14b.jpg · qty 3; results per piece20 mmdrawing reading32.5 kg319.0 N self-weightR₁ 409.5 N
R₂ 409.5 N
UnverifiedDemand only; resistance not established
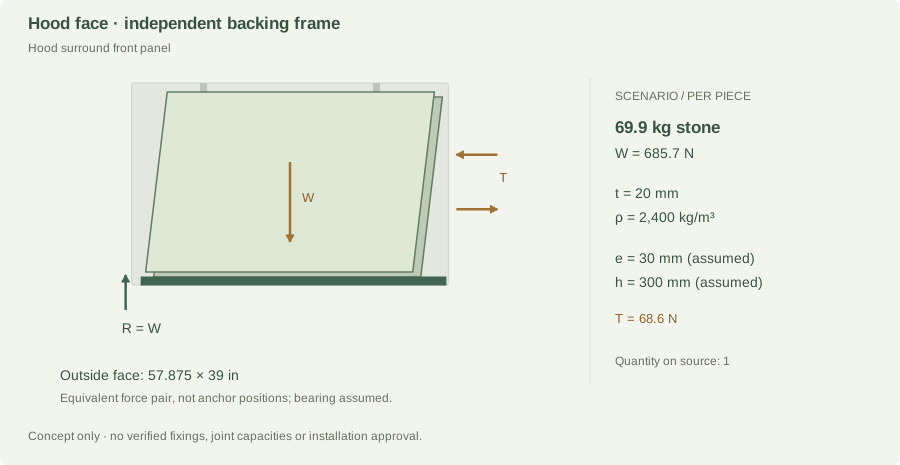
Hood surround front panelproject-14b.jpg · qty 1; results per piece20 mmdrawing reading69.9 kg685.7 N self-weightLedger 685.7 N
Restraint couple 68.6 N
UnverifiedDemand only; resistance not established
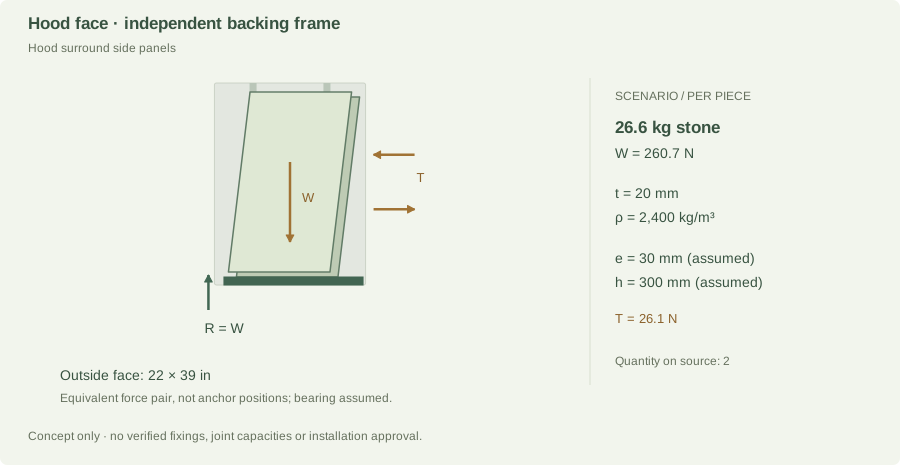
Hood surround side panelsproject-14b.jpg · qty 2; results per piece20 mmdrawing reading26.6 kg260.7 N self-weightLedger 260.7 N
Restraint couple 26.1 N
UnverifiedDemand only; resistance not established

Gross dimensions remain unverified drawing readings. Assumed 20 mm thicknesses and proxy densities are identified in every worked record. These scenario inputs do not replace the fixed measurement tables.

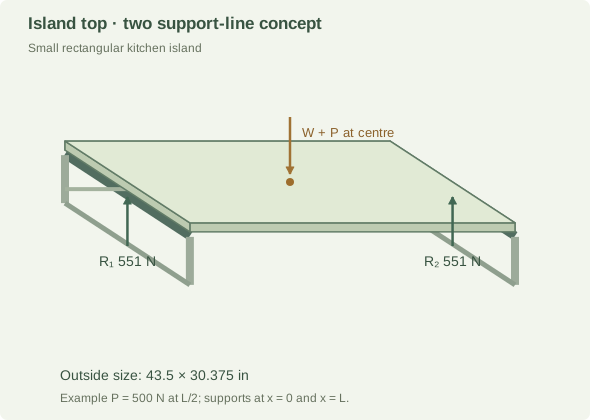
Small rectangular kitchen island End-support reactions · per piece
Small rectangular kitchen island · component-specific load-path diagram
Gross outline from project-14a.jpg; support layout and orientation are scenario assumptions. Image shows one piece; source quantity is 1. Fixture openings are not reconstructed in this gross-outline model.

Gross area 0.8525 m²; thickness 30 mm (drawing reading); density 2,400 kg/m³ (Estimate · historical TCE family range). Openings are not deducted; cutout stress concentrations and remaining stone strips need a separate check.

m = A × t × ρ = 0.8525 × 0.030 × 2,400 = 61.38 kg
W = m × 9.81 = 602.11 N
Assumed end support lines: x = 0 and L = 1.1049 m
Gross-outline centre of mass x̄ = 0.5524 m
Illustrative additional point load P = 500 N at x = L/2
R₂ = (W × x̄ + P × L/2) ÷ L = 551.05 N
R₁ = W + P − R₂ = 551.05 N
Check: R₁ + R₂ = W + P = 1,102.11 N

500 N, where included, is an example load (about a 51 kg mass equivalent), not a prescribed residential design load. Trim-strip examples use self-weight only. The end-line model is a statics exercise: it does not permit this stone to span the full length. Actual rails, cutouts and supports can create a different load distribution.

Joint demand and support strength

If the right edge is a supported butt seam, this piece contributes 551.1 N to its support in the assumed load case. Add the adjoining piece’s edge reaction and applicable loads before selecting that support. No actual seam position or adjoining load is confirmed.

Capacity pending: stone bending and deflection, local bearing, support stiffness, joint shear/peel, connection capacity, load factors and the final design load combinations are not established. A bond area or an adhesive coupon strength alone cannot establish the installed joint’s capacity.

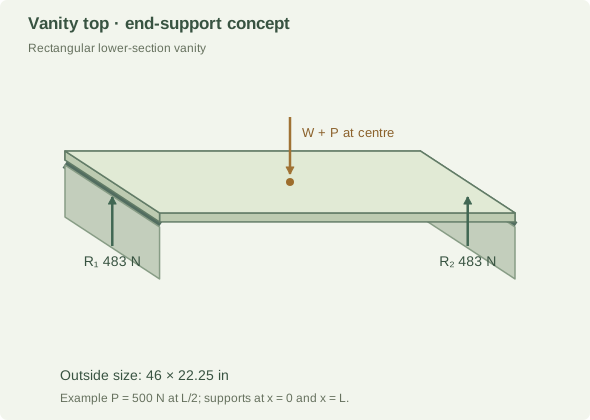
Rectangular lower-section vanity End-support reactions · per piece
Rectangular lower-section vanity · component-specific load-path diagram
Gross outline from project-14a.jpg; support layout and orientation are scenario assumptions. Image shows one piece; source quantity is 1. Fixture openings are not reconstructed in this gross-outline model.

Gross area 0.6603 m²; thickness 30 mm (drawing reading); density 2,400 kg/m³ (Estimate · historical TCE family range). Openings are not deducted; cutout stress concentrations and remaining stone strips need a separate check.

m = A × t × ρ = 0.6603 × 0.030 × 2,400 = 47.54 kg
W = m × 9.81 = 466.40 N
Assumed end support lines: x = 0 and L = 1.1684 m
Gross-outline centre of mass x̄ = 0.5842 m
Illustrative additional point load P = 500 N at x = L/2
R₂ = (W × x̄ + P × L/2) ÷ L = 483.20 N
R₁ = W + P − R₂ = 483.20 N
Check: R₁ + R₂ = W + P = 966.40 N

500 N, where included, is an example load (about a 51 kg mass equivalent), not a prescribed residential design load. Trim-strip examples use self-weight only. The end-line model is a statics exercise: it does not permit this stone to span the full length. Actual rails, cutouts and supports can create a different load distribution.

Joint demand and support strength

If the right edge is a supported butt seam, this piece contributes 483.2 N to its support in the assumed load case. Add the adjoining piece’s edge reaction and applicable loads before selecting that support. No actual seam position or adjoining load is confirmed.

Capacity pending: stone bending and deflection, local bearing, support stiffness, joint shear/peel, connection capacity, load factors and the final design load combinations are not established. A bond area or an adhesive coupon strength alone cannot establish the installed joint’s capacity.

Upper-left green-stone vanity End-support reactions · per piece
Upper-left green-stone vanity · component-specific load-path diagram
Gross outline from project-14a.jpg; support layout and orientation are scenario assumptions. Image shows one piece; source quantity is 1. Fixture openings are not reconstructed in this gross-outline model.

Gross area 0.5610 m²; thickness 20 mm (drawing reading); density 2,699 kg/m³ (Estimate · generic marble proxy). Openings are not deducted; cutout stress concentrations and remaining stone strips need a separate check.

m = A × t × ρ = 0.5610 × 0.020 × 2,699 = 30.28 kg
W = m × 9.81 = 297.07 N
Assumed end support lines: x = 0 and L = 1.0096 m
Gross-outline centre of mass x̄ = 0.5048 m
Illustrative additional point load P = 500 N at x = L/2
R₂ = (W × x̄ + P × L/2) ÷ L = 398.53 N
R₁ = W + P − R₂ = 398.53 N
Check: R₁ + R₂ = W + P = 797.07 N

500 N, where included, is an example load (about a 51 kg mass equivalent), not a prescribed residential design load. Trim-strip examples use self-weight only. The end-line model is a statics exercise: it does not permit this stone to span the full length. Actual rails, cutouts and supports can create a different load distribution.

Joint demand and support strength

If the right edge is a supported butt seam, this piece contributes 398.5 N to its support in the assumed load case. Add the adjoining piece’s edge reaction and applicable loads before selecting that support. No actual seam position or adjoining load is confirmed.

Capacity pending: stone bending and deflection, local bearing, support stiffness, joint shear/peel, connection capacity, load factors and the final design load combinations are not established. A bond area or an adhesive coupon strength alone cannot establish the installed joint’s capacity.

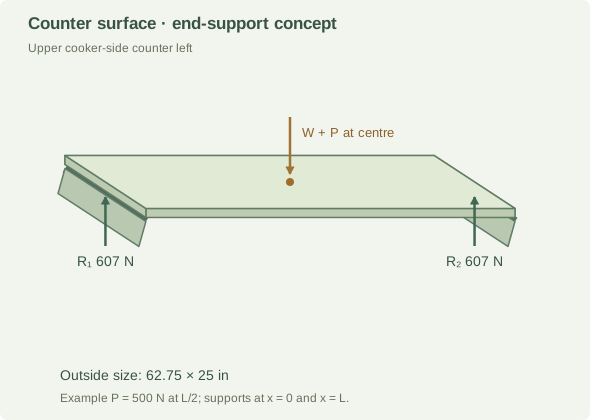
Upper cooker-side counter left End-support reactions · per piece
Upper cooker-side counter left · component-specific load-path diagram
Gross outline from project-14b.jpg; support layout and orientation are scenario assumptions. Image shows one piece; source quantity is 1. Fixture openings are not reconstructed in this gross-outline model.

Gross area 1.0121 m²; thickness 30 mm (drawing reading); density 2,400 kg/m³ (Estimate · comparable quartz). Openings are not deducted; cutout stress concentrations and remaining stone strips need a separate check.

m = A × t × ρ = 1.0121 × 0.030 × 2,400 = 72.87 kg
W = m × 9.81 = 714.86 N
Assumed end support lines: x = 0 and L = 1.5938 m
Gross-outline centre of mass x̄ = 0.7969 m
Illustrative additional point load P = 500 N at x = L/2
R₂ = (W × x̄ + P × L/2) ÷ L = 607.43 N
R₁ = W + P − R₂ = 607.43 N
Check: R₁ + R₂ = W + P = 1,214.86 N

500 N, where included, is an example load (about a 51 kg mass equivalent), not a prescribed residential design load. Trim-strip examples use self-weight only. The end-line model is a statics exercise: it does not permit this stone to span the full length. Actual rails, cutouts and supports can create a different load distribution.

Joint demand and support strength

If the right edge is a supported butt seam, this piece contributes 607.4 N to its support in the assumed load case. Add the adjoining piece’s edge reaction and applicable loads before selecting that support. No actual seam position or adjoining load is confirmed.

Capacity pending: stone bending and deflection, local bearing, support stiffness, joint shear/peel, connection capacity, load factors and the final design load combinations are not established. A bond area or an adhesive coupon strength alone cannot establish the installed joint’s capacity.

Upper cooker-side counter right End-support reactions · per piece
Upper cooker-side counter right · component-specific load-path diagram
Gross outline from project-14b.jpg; support layout and orientation are scenario assumptions. Image shows one piece; source quantity is 1. Fixture openings are not reconstructed in this gross-outline model.

Gross area 1.0121 m²; thickness 30 mm (drawing reading); density 2,400 kg/m³ (Estimate · comparable quartz). Openings are not deducted; cutout stress concentrations and remaining stone strips need a separate check.

m = A × t × ρ = 1.0121 × 0.030 × 2,400 = 72.87 kg
W = m × 9.81 = 714.86 N
Assumed end support lines: x = 0 and L = 1.5938 m
Gross-outline centre of mass x̄ = 0.7969 m
Illustrative additional point load P = 500 N at x = L/2
R₂ = (W × x̄ + P × L/2) ÷ L = 607.43 N
R₁ = W + P − R₂ = 607.43 N
Check: R₁ + R₂ = W + P = 1,214.86 N

500 N, where included, is an example load (about a 51 kg mass equivalent), not a prescribed residential design load. Trim-strip examples use self-weight only. The end-line model is a statics exercise: it does not permit this stone to span the full length. Actual rails, cutouts and supports can create a different load distribution.

Joint demand and support strength

If the right edge is a supported butt seam, this piece contributes 607.4 N to its support in the assumed load case. Add the adjoining piece’s edge reaction and applicable loads before selecting that support. No actual seam position or adjoining load is confirmed.

Capacity pending: stone bending and deflection, local bearing, support stiffness, joint shear/peel, connection capacity, load factors and the final design load combinations are not established. A bond area or an adhesive coupon strength alone cannot establish the installed joint’s capacity.

Upper long counter End-support reactions · per piece
Upper long counter · component-specific load-path diagram
Gross outline from project-14b.jpg; support layout and orientation are scenario assumptions. Image shows one piece; source quantity is 1. Fixture openings are not reconstructed in this gross-outline model.

Gross area 1.5665 m²; thickness 30 mm (drawing reading); density 2,400 kg/m³ (Estimate · comparable quartz). Openings are not deducted; cutout stress concentrations and remaining stone strips need a separate check.

m = A × t × ρ = 1.5665 × 0.030 × 2,400 = 112.79 kg
W = m × 9.81 = 1,106.47 N
Assumed end support lines: x = 0 and L = 2.4670 m
Gross-outline centre of mass x̄ = 1.2335 m
Illustrative additional point load P = 500 N at x = L/2
R₂ = (W × x̄ + P × L/2) ÷ L = 803.24 N
R₁ = W + P − R₂ = 803.24 N
Check: R₁ + R₂ = W + P = 1,606.47 N

500 N, where included, is an example load (about a 51 kg mass equivalent), not a prescribed residential design load. Trim-strip examples use self-weight only. The end-line model is a statics exercise: it does not permit this stone to span the full length. Actual rails, cutouts and supports can create a different load distribution.

Joint demand and support strength

If the right edge is a supported butt seam, this piece contributes 803.2 N to its support in the assumed load case. Add the adjoining piece’s edge reaction and applicable loads before selecting that support. No actual seam position or adjoining load is confirmed.

Capacity pending: stone bending and deflection, local bearing, support stiffness, joint shear/peel, connection capacity, load factors and the final design load combinations are not established. A bond area or an adhesive coupon strength alone cannot establish the installed joint’s capacity.

Small upper-floor vanity End-support reactions · per piece
Small upper-floor vanity · component-specific load-path diagram
Gross outline from project-14b.jpg; support layout and orientation are scenario assumptions. Image shows one piece; source quantity is 1. Fixture openings are not reconstructed in this gross-outline model.

Gross area 0.4463 m²; thickness 20 mm (drawing reading); density 2,400 kg/m³ (Estimate · comparable quartz). Openings are not deducted; cutout stress concentrations and remaining stone strips need a separate check.

m = A × t × ρ = 0.4463 × 0.020 × 2,400 = 21.42 kg
W = m × 9.81 = 210.16 N
Assumed end support lines: x = 0 and L = 0.8033 m
Gross-outline centre of mass x̄ = 0.4016 m
Illustrative additional point load P = 500 N at x = L/2
R₂ = (W × x̄ + P × L/2) ÷ L = 355.08 N
R₁ = W + P − R₂ = 355.08 N
Check: R₁ + R₂ = W + P = 710.16 N

500 N, where included, is an example load (about a 51 kg mass equivalent), not a prescribed residential design load. Trim-strip examples use self-weight only. The end-line model is a statics exercise: it does not permit this stone to span the full length. Actual rails, cutouts and supports can create a different load distribution.

Joint demand and support strength

If the right edge is a supported butt seam, this piece contributes 355.1 N to its support in the assumed load case. Add the adjoining piece’s edge reaction and applicable loads before selecting that support. No actual seam position or adjoining load is confirmed.

Capacity pending: stone bending and deflection, local bearing, support stiffness, joint shear/peel, connection capacity, load factors and the final design load combinations are not established. A bond area or an adhesive coupon strength alone cannot establish the installed joint’s capacity.

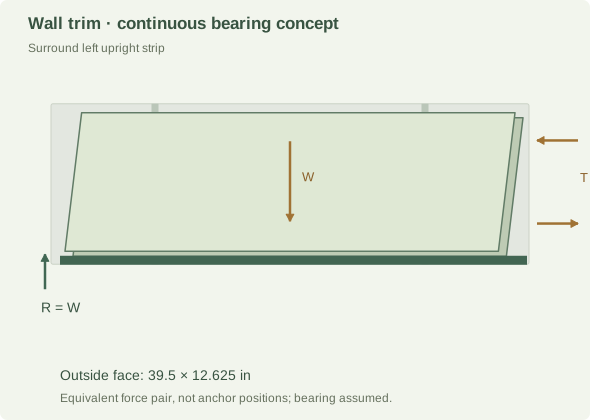
Surround left upright strip Panel load path · per piece
Surround left upright strip · component-specific load-path diagram
Gross outline from project-14b.jpg; support layout and orientation are scenario assumptions. Image shows one piece; source quantity is 1. Fixture openings are not reconstructed in this gross-outline model.

Gross area 0.3217 m²; thickness 20 mm (drawing reading); density 2,400 kg/m³ (Estimate · comparable quartz). Openings are not deducted; cutout stress concentrations and remaining stone strips need a separate check.

m = A × t × ρ = 0.3217 × 0.020 × 2,400 = 15.44 kg
W = m × 9.81 = 151.50 N
Lower bearing demand R = W = 151.5 N
Assumed offset e = 0.030 m; restraint separation h = 0.1924 m
M = W × e = 4.54 N·m
T = M ÷ h = 23.62 N

The assumed separation is the smaller of 300 mm and 60% of the panel’s short outside dimension. This keeps the example couple within its outline; it does not establish anchor placement or edge clearances. The forces form an idealized upper-restraint/lower-bearing couple for one panel. They are not individual anchor capacities. Anchor prying, shared load, substrate strength and lateral/seismic loads are unassigned.

Joint demand and support strength

The bottom joint or ledger must transfer at least the 151.5 N modeled gravity demand from this panel, plus other applicable design actions. Adhesive-only suspension is not assumed.

Capacity pending: stone bending and deflection, local bearing, support stiffness, joint shear/peel, connection capacity, load factors and the final design load combinations are not established. A bond area or an adhesive coupon strength alone cannot establish the installed joint’s capacity.

Surround right upright strip Panel load path · per piece
Surround right upright strip · component-specific load-path diagram
Gross outline from project-14b.jpg; support layout and orientation are scenario assumptions. Image shows one piece; source quantity is 1. Fixture openings are not reconstructed in this gross-outline model.

Gross area 0.3134 m²; thickness 20 mm (drawing reading); density 2,400 kg/m³ (Estimate · comparable quartz). Openings are not deducted; cutout stress concentrations and remaining stone strips need a separate check.

m = A × t × ρ = 0.3134 × 0.020 × 2,400 = 15.04 kg
W = m × 9.81 = 147.56 N
Lower bearing demand R = W = 147.6 N
Assumed offset e = 0.030 m; restraint separation h = 0.1886 m
M = W × e = 4.43 N·m
T = M ÷ h = 23.47 N

The assumed separation is the smaller of 300 mm and 60% of the panel’s short outside dimension. This keeps the example couple within its outline; it does not establish anchor placement or edge clearances. The forces form an idealized upper-restraint/lower-bearing couple for one panel. They are not individual anchor capacities. Anchor prying, shared load, substrate strength and lateral/seismic loads are unassigned.

Joint demand and support strength

The bottom joint or ledger must transfer at least the 147.6 N modeled gravity demand from this panel, plus other applicable design actions. Adhesive-only suspension is not assumed.

Capacity pending: stone bending and deflection, local bearing, support stiffness, joint shear/peel, connection capacity, load factors and the final design load combinations are not established. A bond area or an adhesive coupon strength alone cannot establish the installed joint’s capacity.

Surround left lower panel Panel load path · per piece
Surround left lower panel · component-specific load-path diagram
Gross outline from project-14b.jpg; support layout and orientation are scenario assumptions. Image shows one piece; source quantity is 1. Fixture openings are not reconstructed in this gross-outline model.

Gross area 0.7142 m²; thickness 20 mm (drawing reading); density 2,400 kg/m³ (Estimate · comparable quartz). Openings are not deducted; cutout stress concentrations and remaining stone strips need a separate check.

m = A × t × ρ = 0.7142 × 0.020 × 2,400 = 34.28 kg
W = m × 9.81 = 336.30 N
Lower bearing demand R = W = 336.3 N
Assumed offset e = 0.030 m; restraint separation h = 0.3000 m
M = W × e = 10.09 N·m
T = M ÷ h = 33.63 N

The assumed separation is the smaller of 300 mm and 60% of the panel’s short outside dimension. This keeps the example couple within its outline; it does not establish anchor placement or edge clearances. The forces form an idealized upper-restraint/lower-bearing couple for one panel. They are not individual anchor capacities. Anchor prying, shared load, substrate strength and lateral/seismic loads are unassigned.

Joint demand and support strength

The bottom joint or ledger must transfer at least the 336.3 N modeled gravity demand from this panel, plus other applicable design actions. Adhesive-only suspension is not assumed.

Capacity pending: stone bending and deflection, local bearing, support stiffness, joint shear/peel, connection capacity, load factors and the final design load combinations are not established. A bond area or an adhesive coupon strength alone cannot establish the installed joint’s capacity.

Surround central lower panel Panel load path · per piece
Surround central lower panel · component-specific load-path diagram
Gross outline from project-14b.jpg; support layout and orientation are scenario assumptions. Image shows one piece; source quantity is 1. Fixture openings are not reconstructed in this gross-outline model.

Gross area 1.6516 m²; thickness 20 mm (drawing reading); density 2,400 kg/m³ (Estimate · comparable quartz). Openings are not deducted; cutout stress concentrations and remaining stone strips need a separate check.

m = A × t × ρ = 1.6516 × 0.020 × 2,400 = 79.28 kg
W = m × 9.81 = 777.72 N
Lower bearing demand R = W = 777.7 N
Assumed offset e = 0.030 m; restraint separation h = 0.3000 m
M = W × e = 23.33 N·m
T = M ÷ h = 77.77 N

The assumed separation is the smaller of 300 mm and 60% of the panel’s short outside dimension. This keeps the example couple within its outline; it does not establish anchor placement or edge clearances. The forces form an idealized upper-restraint/lower-bearing couple for one panel. They are not individual anchor capacities. Anchor prying, shared load, substrate strength and lateral/seismic loads are unassigned.

Joint demand and support strength

The bottom joint or ledger must transfer at least the 777.7 N modeled gravity demand from this panel, plus other applicable design actions. Adhesive-only suspension is not assumed.

Capacity pending: stone bending and deflection, local bearing, support stiffness, joint shear/peel, connection capacity, load factors and the final design load combinations are not established. A bond area or an adhesive coupon strength alone cannot establish the installed joint’s capacity.

Surround right lower panel Panel load path · per piece
Surround right lower panel · component-specific load-path diagram
Gross outline from project-14b.jpg; support layout and orientation are scenario assumptions. Image shows one piece; source quantity is 1. Fixture openings are not reconstructed in this gross-outline model.

Gross area 0.7105 m²; thickness 20 mm (drawing reading); density 2,400 kg/m³ (Estimate · comparable quartz). Openings are not deducted; cutout stress concentrations and remaining stone strips need a separate check.

m = A × t × ρ = 0.7105 × 0.020 × 2,400 = 34.10 kg
W = m × 9.81 = 334.55 N
Lower bearing demand R = W = 334.5 N
Assumed offset e = 0.030 m; restraint separation h = 0.3000 m
M = W × e = 10.04 N·m
T = M ÷ h = 33.45 N

The assumed separation is the smaller of 300 mm and 60% of the panel’s short outside dimension. This keeps the example couple within its outline; it does not establish anchor placement or edge clearances. The forces form an idealized upper-restraint/lower-bearing couple for one panel. They are not individual anchor capacities. Anchor prying, shared load, substrate strength and lateral/seismic loads are unassigned.

Joint demand and support strength

The bottom joint or ledger must transfer at least the 334.5 N modeled gravity demand from this panel, plus other applicable design actions. Adhesive-only suspension is not assumed.

Capacity pending: stone bending and deflection, local bearing, support stiffness, joint shear/peel, connection capacity, load factors and the final design load combinations are not established. A bond area or an adhesive coupon strength alone cannot establish the installed joint’s capacity.

Three shelf/panel rectangles End-support reactions · per piece
Three shelf/panel rectangles · component-specific load-path diagram
Gross outline from project-14b.jpg; support layout and orientation are scenario assumptions. Image shows one piece; source quantity is 3. Fixture openings are not reconstructed in this gross-outline model.

Gross area 0.6774 m²; thickness 20 mm (drawing reading); density 2,400 kg/m³ (Estimate · comparable quartz). Openings are not deducted; cutout stress concentrations and remaining stone strips need a separate check.

m = A × t × ρ = 0.6774 × 0.020 × 2,400 = 32.52 kg
W = m × 9.81 = 318.98 N
Assumed end support lines: x = 0 and L = 1.2700 m
Gross-outline centre of mass x̄ = 0.6350 m
Illustrative additional point load P = 500 N at x = L/2
R₂ = (W × x̄ + P × L/2) ÷ L = 409.49 N
R₁ = W + P − R₂ = 409.49 N
Check: R₁ + R₂ = W + P = 818.98 N

500 N, where included, is an example load (about a 51 kg mass equivalent), not a prescribed residential design load. Trim-strip examples use self-weight only. The end-line model is a statics exercise: it does not permit this stone to span the full length. Actual rails, cutouts and supports can create a different load distribution.

Joint demand and support strength

If the right edge is a supported butt seam, this piece contributes 409.5 N to its support in the assumed load case. Add the adjoining piece’s edge reaction and applicable loads before selecting that support. No actual seam position or adjoining load is confirmed.

Capacity pending: stone bending and deflection, local bearing, support stiffness, joint shear/peel, connection capacity, load factors and the final design load combinations are not established. A bond area or an adhesive coupon strength alone cannot establish the installed joint’s capacity.

Hood surround front panel Panel load path · per piece
Hood surround front panel · component-specific load-path diagram
Gross outline from project-14b.jpg; support layout and orientation are scenario assumptions. Image shows one piece; source quantity is 1. Fixture openings are not reconstructed in this gross-outline model.

Gross area 1.4562 m²; thickness 20 mm (drawing reading); density 2,400 kg/m³ (Estimate · comparable quartz). Openings are not deducted; cutout stress concentrations and remaining stone strips need a separate check.

m = A × t × ρ = 1.4562 × 0.020 × 2,400 = 69.90 kg
W = m × 9.81 = 685.70 N
Lower bearing demand R = W = 685.7 N
Assumed offset e = 0.030 m; restraint separation h = 0.3000 m
M = W × e = 20.57 N·m
T = M ÷ h = 68.57 N

The assumed separation is the smaller of 300 mm and 60% of the panel’s short outside dimension. This keeps the example couple within its outline; it does not establish anchor placement or edge clearances. The forces form an idealized upper-restraint/lower-bearing couple for one panel. They are not individual anchor capacities. Anchor prying, shared load, substrate strength and lateral/seismic loads are unassigned.

Joint demand and support strength

The bottom joint or ledger must transfer at least the 685.7 N modeled gravity demand from this panel, plus other applicable design actions. Adhesive-only suspension is not assumed.

Capacity pending: stone bending and deflection, local bearing, support stiffness, joint shear/peel, connection capacity, load factors and the final design load combinations are not established. A bond area or an adhesive coupon strength alone cannot establish the installed joint’s capacity.

Hood surround side panels Panel load path · per piece
Hood surround side panels · component-specific load-path diagram
Gross outline from project-14b.jpg; support layout and orientation are scenario assumptions. Image shows one piece; source quantity is 2. Fixture openings are not reconstructed in this gross-outline model.

Gross area 0.5535 m²; thickness 20 mm (drawing reading); density 2,400 kg/m³ (Estimate · comparable quartz). Openings are not deducted; cutout stress concentrations and remaining stone strips need a separate check.

m = A × t × ρ = 0.5535 × 0.020 × 2,400 = 26.57 kg
W = m × 9.81 = 260.65 N
Lower bearing demand R = W = 260.7 N
Assumed offset e = 0.030 m; restraint separation h = 0.3000 m
M = W × e = 7.82 N·m
T = M ÷ h = 26.07 N

The assumed separation is the smaller of 300 mm and 60% of the panel’s short outside dimension. This keeps the example couple within its outline; it does not establish anchor placement or edge clearances. The forces form an idealized upper-restraint/lower-bearing couple for one panel. They are not individual anchor capacities. Anchor prying, shared load, substrate strength and lateral/seismic loads are unassigned.

Joint demand and support strength

The bottom joint or ledger must transfer at least the 260.7 N modeled gravity demand from this panel, plus other applicable design actions. Adhesive-only suspension is not assumed.

Capacity pending: stone bending and deflection, local bearing, support stiffness, joint shear/peel, connection capacity, load factors and the final design load combinations are not established. A bond area or an adhesive coupon strength alone cannot establish the installed joint’s capacity.

A real bracket, in a separate example bay.

This example uses TCE1220 at 30 mm and 2,400 kg/m³. It does not claim this overhang exists in Project 14. A 350 mm overhang, 400 mm tributary width and 500 N tip load are deliberately assumed.

Calculated load demands

W_bay = ρ × t × 0.400 × 0.350 × 9.81 = 98.88 N
V = W_bay + 500 = 598.88 N
M_root = W_bay × 0.350/2 + 500 × 0.350
= 192.30 N·m
For a separate ideal connection with h = 0.150 m:
T_couple = M_root ÷ h = 1,282.03 N

The 150 mm force-couple lever arm is an algebra example for a vertically separated connection. It is not the Liberty’s flush-mounted lag-screw geometry or an anchor specification.

Federal Brace Liberty · SKU 30247

Published carry reference: 375 lbf per bracket ≈ 1,668 N. The bracket has a 12 in support projection plus 4⅛ in mounting length, with a 3 in width and ¼ in steel thickness.

Its guide calls for double 2×4 knee-wall blocking tied into the floor, flush/level mounting and spacing no greater than 18 in (457 mm). The 400 mm example bay is within that spacing figure. The assumed 350 mm overhang extends about 45 mm beyond the 305 mm arm; permissible stone extension still needs confirmation.

Comparison, not approval: the calculated 599 N shear is 35.9% of the catalog force reference. The guide does not establish the actual anchor-group moment resistance, stone capacity, test load position or an applicable design safety factor. Those checks remain open.

Other support and joint references.

Sink Setter PW-104-P

A separate cabinet-supported sink cradle can keep sink and water loads off an adhesive seam. The manufacturer’s telescoping rail range is 25–47 in; no numeric capacity was verified. Confirm cabinet clear width, sink weight, contained water and rail capacity.

PW-99-P and PW-104-P installation instructions — Sink Setter ↗

Stone seams and adhesive

Prefer a defined bearing path below a seam. An unsupported miter can carry shear, bending and peel; average shear alone is insufficient. The adhesive, substrate, bond geometry, cure, durability and design resistance must match the actual joint.

For example, 3M DP420 Black publishes a 17 MPa aluminum lap-shear test after seven days at 23°C. That is not a stone-to-stone seam allowable, so it is not used to size these joints.

3M Scotch-Weld Epoxy AdhesiveDP420 Black — English-EU technical data ↗

What is needed to finish the strength check?

Required resistance must cover the governing design demand on a consistent load/resistance basis. These pages calculate selected service-load demands; they do not supply tested allowable capacities or a code-compliant design factor. Stone cracking, deflection and joint failure therefore remain unresolved.

Sources, scope and calculation record

Force balance and moments use algebra: ΣF = 0 and ΣM = 0. No calculus is required for these demand examples.

Manufacturer tables apply only within their stated products, thicknesses, regions and installation conditions. They are not copied into a universal allowable-span rule. Research checked 24 October 2026.

Download assumptions and calculation record ↓
Return to project measurements →