← Project 05

PROJECT 05 / SUPPORTS & JOINTS

Waterfall island and related stonework
Support examples

These examples calculate forces from selected drawing outlines. Supports and extra loads are assumed so the options can be compared.

Preliminary design scenarios · strength verification pending

Support positions, load cases, fixings and joint details were not supplied. The following examples are created for comparison; they do not establish that any completed job or proposed installation is safe.

Structural options for this project.

Cabinet perimeter + local rails

A continuous, level cabinet frame carries the top. Add independently supported rails at seams and fixture openings after the cabinet layout is confirmed.

Requires cabinet bearing lines, cutout templates and local manufacturer guidance.

Independent frame or legs

A frame beneath an island, desk or seating surface can transfer loads directly to legs and the floor, reducing dependence on a stone seam.

Frame member bending, deflection, connections, stability and floor capacity still need design.

Concealed bracket option

For an open edge, compare a bracketed bay with a floor-tied knee wall or structurally reinforced cabinet. The Liberty example below illustrates one product’s conditions.

Actual overhang, tip setback, blocking, anchors and slab-specific limits are unverified.

Panel ledger + lateral restraints

For vertical faces, a bottom ledger can carry gravity while separate restraints resist out-of-plane movement. A framed backing system is another option.

Verify panel orientation, substrate, anchors, eccentricity, movement and any appliance heat clearances.

Waterfall joint with a separate load path

Model the top on its own frame or cabinet support. Treat the visible miter as a finish joint until a tested load-bearing connection is designed.

The waterfall face is not assumed to replace a rated leg, bracket or frame.

What each piece asks its supports to carry.

Results are per physical piece; quantities are shown separately. Alternative drawing sheets are not added together. Horizontal surface examples add an illustrative 500 N point load to stone self-weight; trim strips and vertical panels use self-weight only.

Component / sourceThickness basisScenario mass / gravitySupport demandStrength check
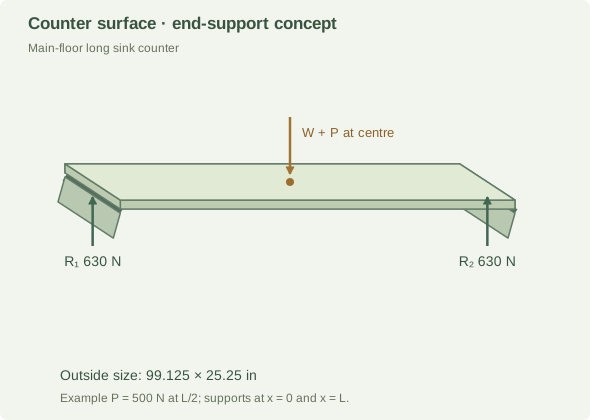
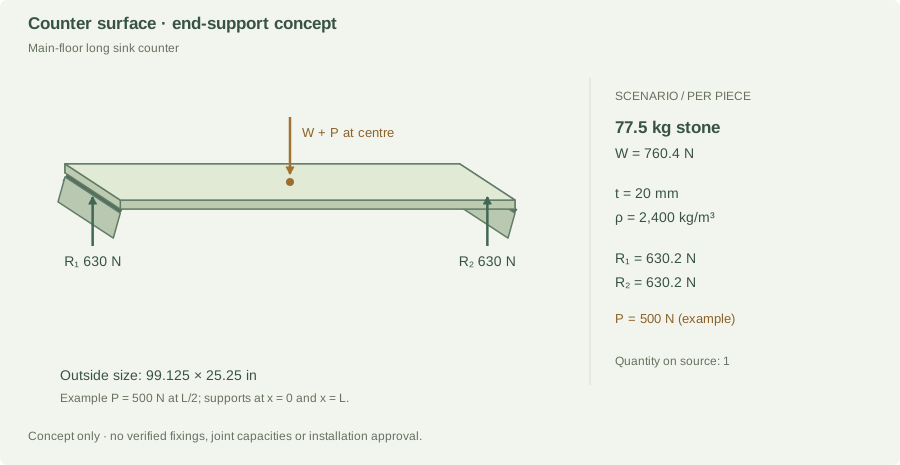
Main-floor long sink counterproject-5.jpg · qty 1; results per piece20 mmdrawing reading77.5 kg760.4 N self-weightR₁ 630.2 N
R₂ 630.2 N
UnverifiedDemand only; resistance not established
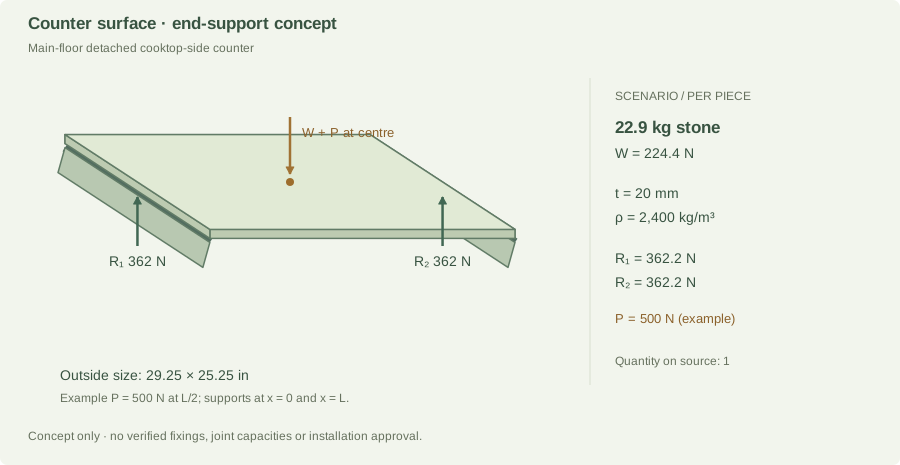
Main-floor detached cooktop-side counterproject-5.jpg · qty 1; results per piece20 mmdrawing reading22.9 kg224.4 N self-weightR₁ 362.2 N
R₂ 362.2 N
UnverifiedDemand only; resistance not established
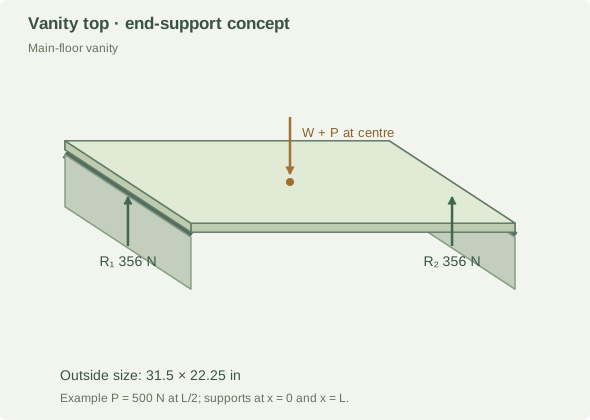
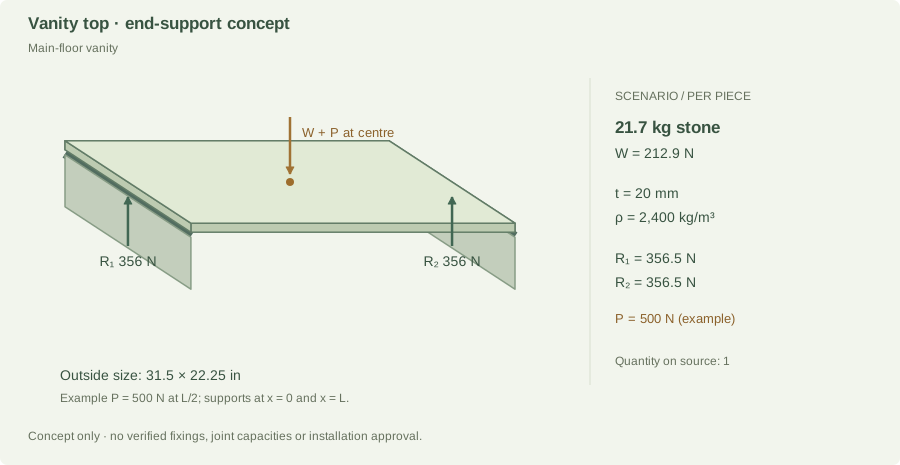
Main-floor vanityproject-5.jpg · qty 1; results per piece20 mmdrawing reading21.7 kg212.9 N self-weightR₁ 356.5 N
R₂ 356.5 N
UnverifiedDemand only; resistance not established
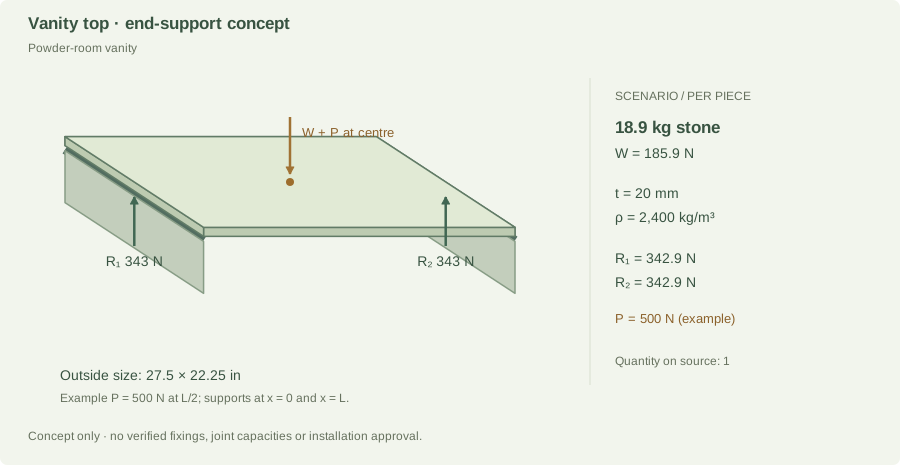
Powder-room vanityproject-5.jpg · qty 1; results per piece20 mmdrawing reading18.9 kg185.9 N self-weightR₁ 342.9 N
R₂ 342.9 N
UnverifiedDemand only; resistance not established
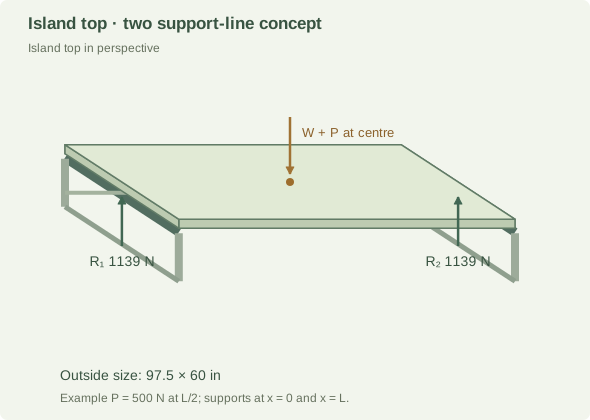
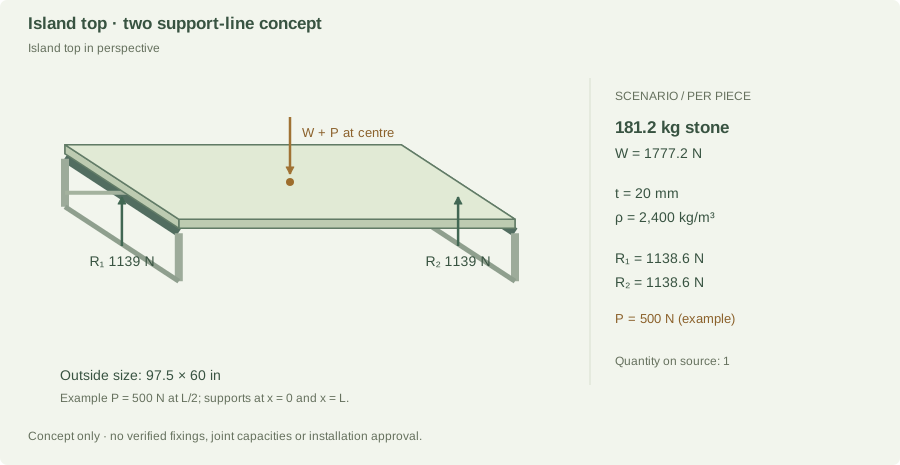
Island top in perspectiveproject-5.jpg · qty 1; results per piece20 mmdrawing reading181.2 kg1,777.2 N self-weightR₁ 1,138.6 N
R₂ 1,138.6 N
UnverifiedDemand only; resistance not established
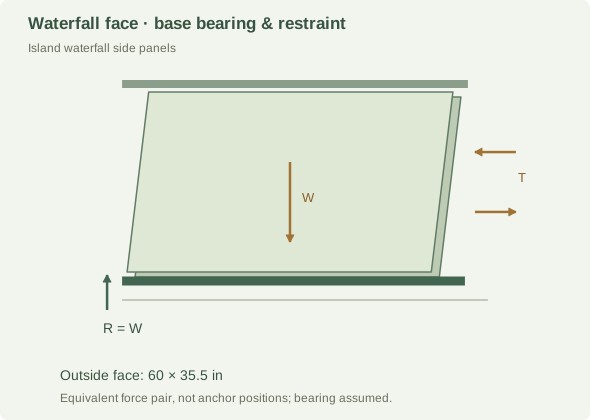
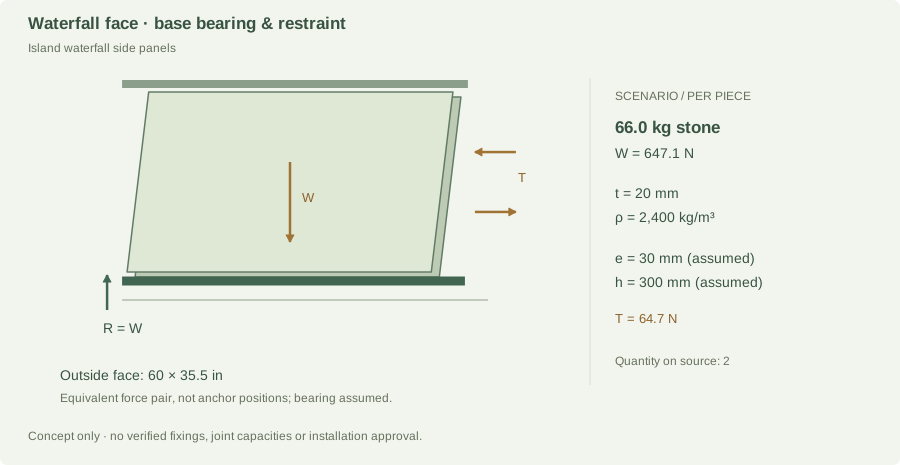
Island waterfall side panelsproject-5.jpg · qty 2; results per piece20 mmdrawing reading66.0 kg647.1 N self-weightLedger 647.1 N
Restraint couple 64.7 N
UnverifiedDemand only; resistance not established
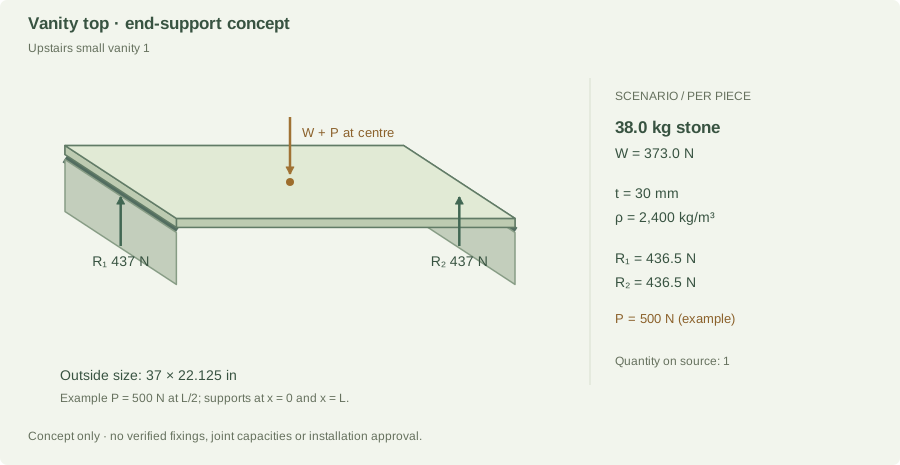
Upstairs small vanity 1project-5.jpg · qty 1; results per piece30 mmdrawing reading38.0 kg373.0 N self-weightR₁ 436.5 N
R₂ 436.5 N
UnverifiedDemand only; resistance not established
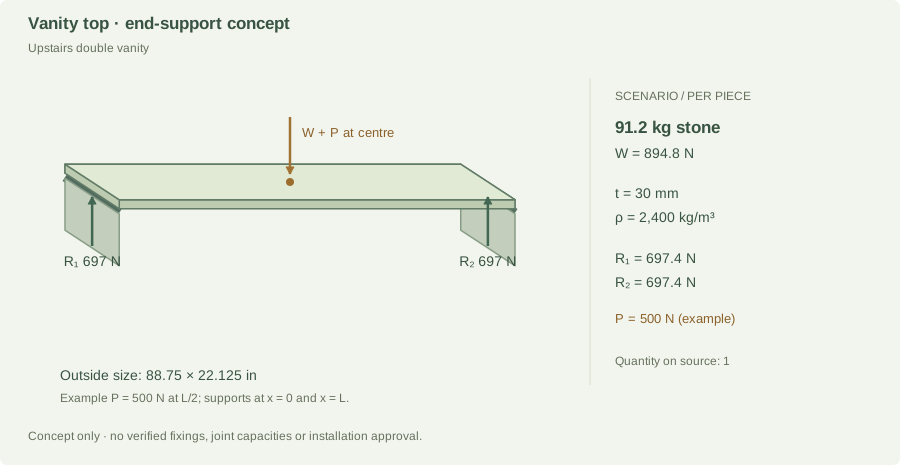
Upstairs double vanityproject-5.jpg · qty 1; results per piece30 mmdrawing reading91.2 kg894.8 N self-weightR₁ 697.4 N
R₂ 697.4 N
UnverifiedDemand only; resistance not established
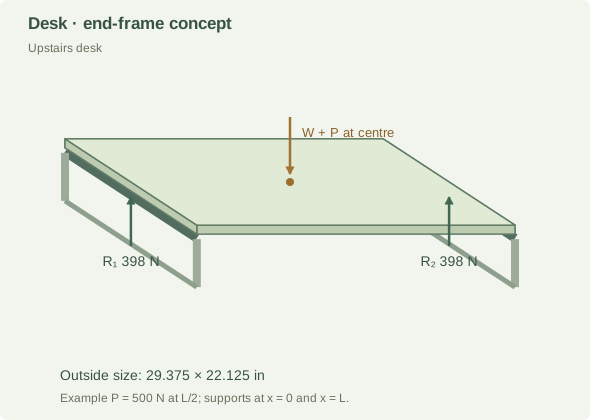
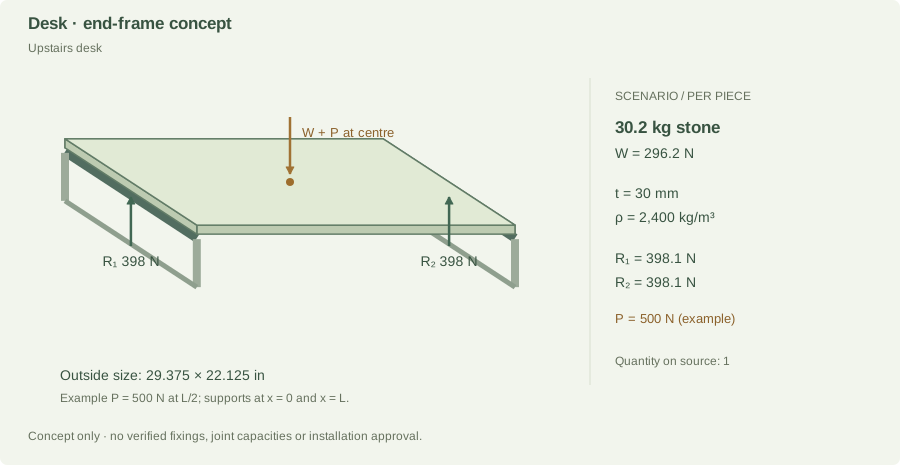
Upstairs deskproject-5.jpg · qty 1; results per piece30 mmdrawing reading30.2 kg296.2 N self-weightR₁ 398.1 N
R₂ 398.1 N
UnverifiedDemand only; resistance not established
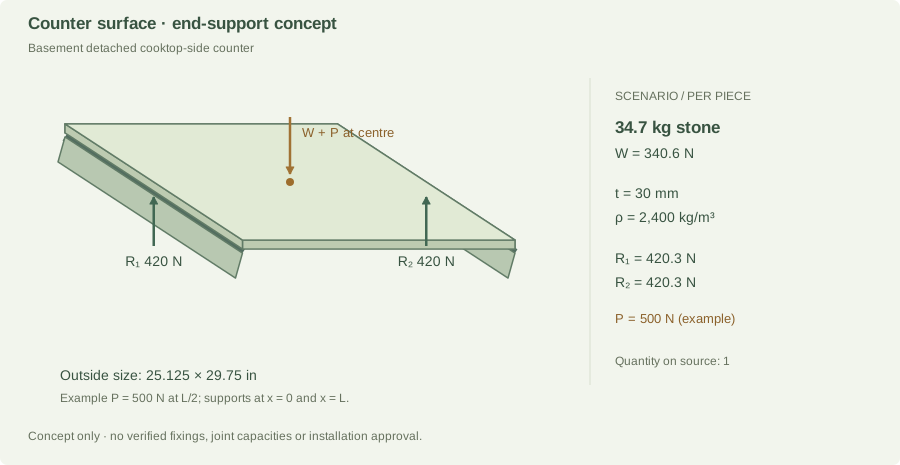
Basement detached cooktop-side counterproject-5.jpg · qty 1; results per piece30 mmdrawing reading34.7 kg340.6 N self-weightR₁ 420.3 N
R₂ 420.3 N
UnverifiedDemand only; resistance not established
Basement vanityproject-5.jpg · qty 1; results per piece30 mmdrawing reading47.0 kg461.3 N self-weightR₁ 480.7 N
R₂ 480.7 N
UnverifiedDemand only; resistance not established
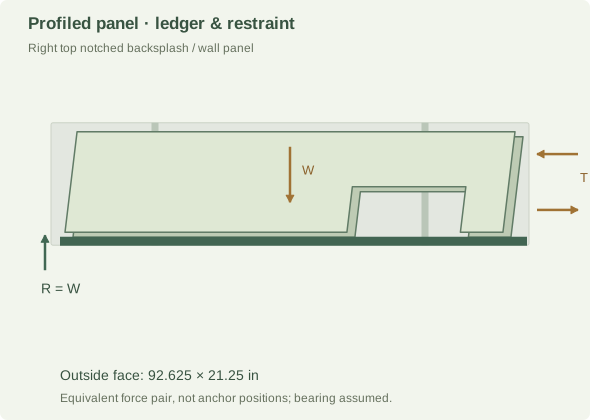
Right top notched backsplash / wall panelproject-5.jpg · qty 1; results per piece20 mm20 mm scenario assumption; thickness not on the paper53.8 kg527.8 N self-weightLedger 527.8 N
Restraint couple 52.8 N
UnverifiedDemand only; resistance not established
Right stepped backsplash / wall panelproject-5.jpg · qty 1; results per piece20 mm20 mm scenario assumption; thickness not on the paper77.8 kg763.2 N self-weightLedger 763.2 N
Restraint couple 76.3 N
UnverifiedDemand only; resistance not established
Right centre rectangular backsplash / wall panelproject-5.jpg · qty 1; results per piece20 mm20 mm scenario assumption; thickness not on the paper79.8 kg783.0 N self-weightLedger 783.0 N
Restraint couple 78.3 N
UnverifiedDemand only; resistance not established
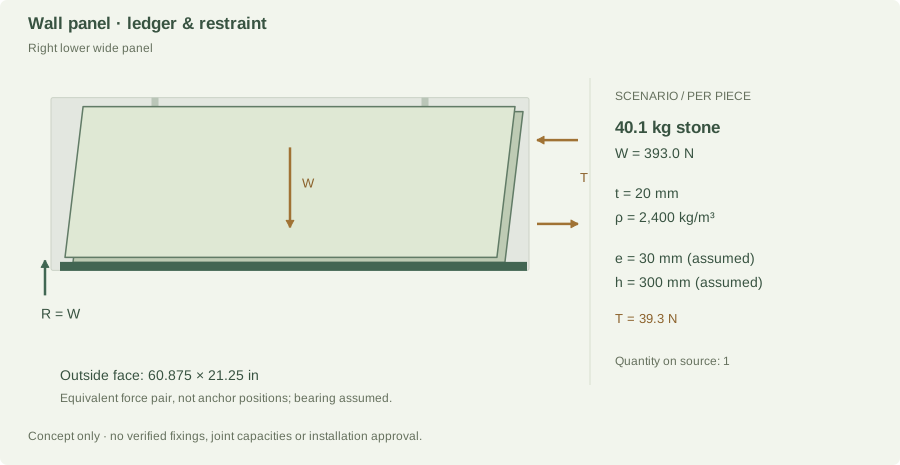
Right lower wide panelproject-5.jpg · qty 1; results per piece20 mm20 mm scenario assumption; thickness not on the paper40.1 kg393.0 N self-weightLedger 393.0 N
Restraint couple 39.3 N
UnverifiedDemand only; resistance not established
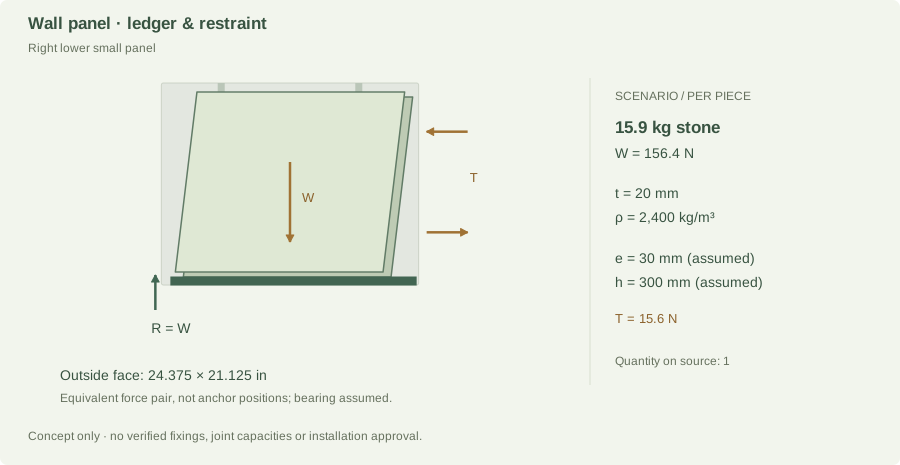
Right lower small panelproject-5.jpg · qty 1; results per piece20 mm20 mm scenario assumption; thickness not on the paper15.9 kg156.4 N self-weightLedger 156.4 N
Restraint couple 15.6 N
UnverifiedDemand only; resistance not established
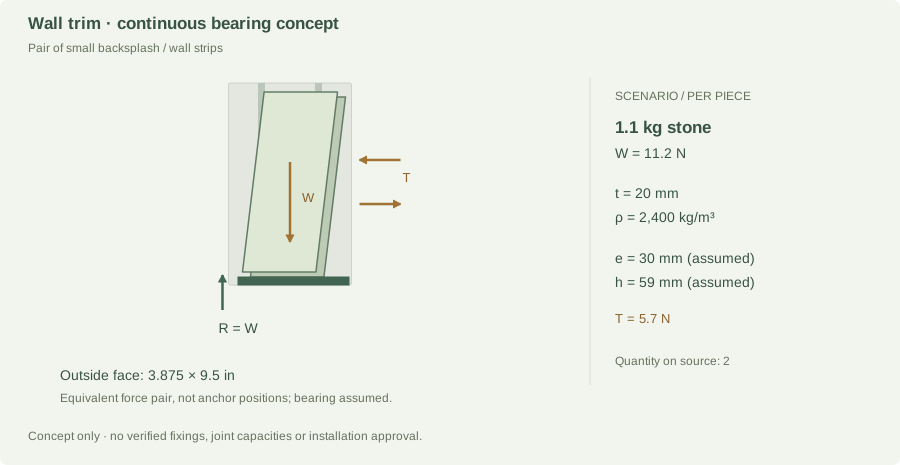
Pair of small backsplash / wall stripsproject-5.jpg · qty 2; results per piece20 mm20 mm scenario assumption; thickness not on the paper1.1 kg11.2 N self-weightLedger 11.2 N
Restraint couple 5.7 N
UnverifiedDemand only; resistance not established
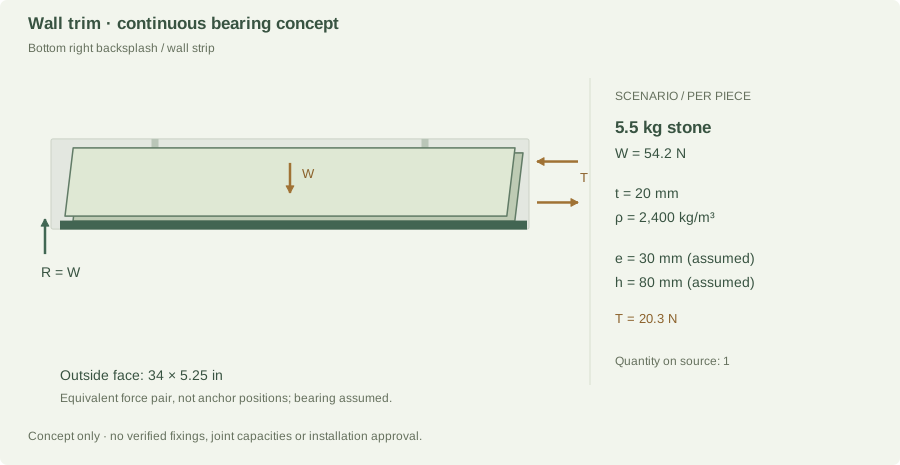
Bottom right backsplash / wall stripproject-5.jpg · qty 1; results per piece20 mm20 mm scenario assumption; thickness not on the paper5.5 kg54.2 N self-weightLedger 54.2 N
Restraint couple 20.3 N
UnverifiedDemand only; resistance not established

Gross dimensions remain unverified drawing readings. Assumed 20 mm thicknesses and proxy densities are identified in every worked record. These scenario inputs do not replace the fixed measurement tables.

Main-floor long sink counter End-support reactions · per piece
Main-floor long sink counter · component-specific load-path diagram
Gross outline from project-5.jpg; support layout and orientation are scenario assumptions. Image shows one piece; source quantity is 1. Fixture openings are not reconstructed in this gross-outline model.

Gross area 1.6148 m²; thickness 20 mm (drawing reading); density 2,400 kg/m³ (Estimate · historical TCE family range). Openings are not deducted; cutout stress concentrations and remaining stone strips need a separate check.

m = A × t × ρ = 1.6148 × 0.020 × 2,400 = 77.51 kg
W = m × 9.81 = 760.37 N
Assumed end support lines: x = 0 and L = 2.5178 m
Gross-outline centre of mass x̄ = 1.2589 m
Illustrative additional point load P = 500 N at x = L/2
R₂ = (W × x̄ + P × L/2) ÷ L = 630.18 N
R₁ = W + P − R₂ = 630.18 N
Check: R₁ + R₂ = W + P = 1,260.37 N

500 N, where included, is an example load (about a 51 kg mass equivalent), not a prescribed residential design load. Trim-strip examples use self-weight only. The end-line model is a statics exercise: it does not permit this stone to span the full length. Actual rails, cutouts and supports can create a different load distribution.

Joint demand and support strength

If the right edge is a supported butt seam, this piece contributes 630.2 N to its support in the assumed load case. Add the adjoining piece’s edge reaction and applicable loads before selecting that support. No actual seam position or adjoining load is confirmed.

Capacity pending: stone bending and deflection, local bearing, support stiffness, joint shear/peel, connection capacity, load factors and the final design load combinations are not established. A bond area or an adhesive coupon strength alone cannot establish the installed joint’s capacity.

Main-floor detached cooktop-side counter End-support reactions · per piece
Main-floor detached cooktop-side counter · component-specific load-path diagram
Gross outline from project-5.jpg; support layout and orientation are scenario assumptions. Image shows one piece; source quantity is 1. Fixture openings are not reconstructed in this gross-outline model.

Gross area 0.4765 m²; thickness 20 mm (drawing reading); density 2,400 kg/m³ (Estimate · historical TCE family range). Openings are not deducted; cutout stress concentrations and remaining stone strips need a separate check.

m = A × t × ρ = 0.4765 × 0.020 × 2,400 = 22.87 kg
W = m × 9.81 = 224.37 N
Assumed end support lines: x = 0 and L = 0.7429 m
Gross-outline centre of mass x̄ = 0.3715 m
Illustrative additional point load P = 500 N at x = L/2
R₂ = (W × x̄ + P × L/2) ÷ L = 362.19 N
R₁ = W + P − R₂ = 362.19 N
Check: R₁ + R₂ = W + P = 724.37 N

500 N, where included, is an example load (about a 51 kg mass equivalent), not a prescribed residential design load. Trim-strip examples use self-weight only. The end-line model is a statics exercise: it does not permit this stone to span the full length. Actual rails, cutouts and supports can create a different load distribution.

Joint demand and support strength

If the right edge is a supported butt seam, this piece contributes 362.2 N to its support in the assumed load case. Add the adjoining piece’s edge reaction and applicable loads before selecting that support. No actual seam position or adjoining load is confirmed.

Capacity pending: stone bending and deflection, local bearing, support stiffness, joint shear/peel, connection capacity, load factors and the final design load combinations are not established. A bond area or an adhesive coupon strength alone cannot establish the installed joint’s capacity.

Main-floor vanity End-support reactions · per piece
Main-floor vanity · component-specific load-path diagram
Gross outline from project-5.jpg; support layout and orientation are scenario assumptions. Image shows one piece; source quantity is 1. Fixture openings are not reconstructed in this gross-outline model.

Gross area 0.4522 m²; thickness 20 mm (drawing reading); density 2,400 kg/m³ (Estimate · historical TCE family range). Openings are not deducted; cutout stress concentrations and remaining stone strips need a separate check.

m = A × t × ρ = 0.4522 × 0.020 × 2,400 = 21.70 kg
W = m × 9.81 = 212.92 N
Assumed end support lines: x = 0 and L = 0.8001 m
Gross-outline centre of mass x̄ = 0.4000 m
Illustrative additional point load P = 500 N at x = L/2
R₂ = (W × x̄ + P × L/2) ÷ L = 356.46 N
R₁ = W + P − R₂ = 356.46 N
Check: R₁ + R₂ = W + P = 712.92 N

500 N, where included, is an example load (about a 51 kg mass equivalent), not a prescribed residential design load. Trim-strip examples use self-weight only. The end-line model is a statics exercise: it does not permit this stone to span the full length. Actual rails, cutouts and supports can create a different load distribution.

Joint demand and support strength

If the right edge is a supported butt seam, this piece contributes 356.5 N to its support in the assumed load case. Add the adjoining piece’s edge reaction and applicable loads before selecting that support. No actual seam position or adjoining load is confirmed.

Capacity pending: stone bending and deflection, local bearing, support stiffness, joint shear/peel, connection capacity, load factors and the final design load combinations are not established. A bond area or an adhesive coupon strength alone cannot establish the installed joint’s capacity.

Powder-room vanity End-support reactions · per piece
Powder-room vanity · component-specific load-path diagram
Gross outline from project-5.jpg; support layout and orientation are scenario assumptions. Image shows one piece; source quantity is 1. Fixture openings are not reconstructed in this gross-outline model.

Gross area 0.3948 m²; thickness 20 mm (drawing reading); density 2,400 kg/m³ (Estimate · historical TCE family range). Openings are not deducted; cutout stress concentrations and remaining stone strips need a separate check.

m = A × t × ρ = 0.3948 × 0.020 × 2,400 = 18.95 kg
W = m × 9.81 = 185.88 N
Assumed end support lines: x = 0 and L = 0.6985 m
Gross-outline centre of mass x̄ = 0.3493 m
Illustrative additional point load P = 500 N at x = L/2
R₂ = (W × x̄ + P × L/2) ÷ L = 342.94 N
R₁ = W + P − R₂ = 342.94 N
Check: R₁ + R₂ = W + P = 685.88 N

500 N, where included, is an example load (about a 51 kg mass equivalent), not a prescribed residential design load. Trim-strip examples use self-weight only. The end-line model is a statics exercise: it does not permit this stone to span the full length. Actual rails, cutouts and supports can create a different load distribution.

Joint demand and support strength

If the right edge is a supported butt seam, this piece contributes 342.9 N to its support in the assumed load case. Add the adjoining piece’s edge reaction and applicable loads before selecting that support. No actual seam position or adjoining load is confirmed.

Capacity pending: stone bending and deflection, local bearing, support stiffness, joint shear/peel, connection capacity, load factors and the final design load combinations are not established. A bond area or an adhesive coupon strength alone cannot establish the installed joint’s capacity.

Island top in perspective End-support reactions · per piece
Island top in perspective · component-specific load-path diagram
Gross outline from project-5.jpg; support layout and orientation are scenario assumptions. Image shows one piece; source quantity is 1. Fixture openings are not reconstructed in this gross-outline model.

Gross area 3.7742 m²; thickness 20 mm (drawing reading); density 2,400 kg/m³ (Estimate · historical TCE family range). Openings are not deducted; cutout stress concentrations and remaining stone strips need a separate check.

m = A × t × ρ = 3.7742 × 0.020 × 2,400 = 181.16 kg
W = m × 9.81 = 1,777.19 N
Assumed end support lines: x = 0 and L = 2.4765 m
Gross-outline centre of mass x̄ = 1.2382 m
Illustrative additional point load P = 500 N at x = L/2
R₂ = (W × x̄ + P × L/2) ÷ L = 1,138.59 N
R₁ = W + P − R₂ = 1,138.59 N
Check: R₁ + R₂ = W + P = 2,277.19 N

500 N, where included, is an example load (about a 51 kg mass equivalent), not a prescribed residential design load. Trim-strip examples use self-weight only. The end-line model is a statics exercise: it does not permit this stone to span the full length. Actual rails, cutouts and supports can create a different load distribution.

Joint demand and support strength

If the right edge is a supported butt seam, this piece contributes 1,138.6 N to its support in the assumed load case. Add the adjoining piece’s edge reaction and applicable loads before selecting that support. No actual seam position or adjoining load is confirmed.

Capacity pending: stone bending and deflection, local bearing, support stiffness, joint shear/peel, connection capacity, load factors and the final design load combinations are not established. A bond area or an adhesive coupon strength alone cannot establish the installed joint’s capacity.

Island waterfall side panels Panel load path · per piece
Island waterfall side panels · component-specific load-path diagram
Gross outline from project-5.jpg; support layout and orientation are scenario assumptions. Image shows one piece; source quantity is 2. Fixture openings are not reconstructed in this gross-outline model.

Gross area 1.3742 m²; thickness 20 mm (drawing reading); density 2,400 kg/m³ (Estimate · historical TCE family range). Openings are not deducted; cutout stress concentrations and remaining stone strips need a separate check.

m = A × t × ρ = 1.3742 × 0.020 × 2,400 = 65.96 kg
W = m × 9.81 = 647.08 N
Lower bearing demand R = W = 647.1 N
Assumed offset e = 0.030 m; restraint separation h = 0.3000 m
M = W × e = 19.41 N·m
T = M ÷ h = 64.71 N

The assumed separation is the smaller of 300 mm and 60% of the panel’s short outside dimension. This keeps the example couple within its outline; it does not establish anchor placement or edge clearances. The forces form an idealized upper-restraint/lower-bearing couple for one panel. They are not individual anchor capacities. Anchor prying, shared load, substrate strength and lateral/seismic loads are unassigned.

Joint demand and support strength

The bottom joint or ledger must transfer at least the 647.1 N modeled gravity demand from this panel, plus other applicable design actions. Adhesive-only suspension is not assumed.

Capacity pending: stone bending and deflection, local bearing, support stiffness, joint shear/peel, connection capacity, load factors and the final design load combinations are not established. A bond area or an adhesive coupon strength alone cannot establish the installed joint’s capacity.

Upstairs small vanity 1 End-support reactions · per piece
Upstairs small vanity 1 · component-specific load-path diagram
Gross outline from project-5.jpg; support layout and orientation are scenario assumptions. Image shows one piece; source quantity is 1. Fixture openings are not reconstructed in this gross-outline model.

Gross area 0.5281 m²; thickness 30 mm (drawing reading); density 2,400 kg/m³ (Estimate · historical TCE family range). Openings are not deducted; cutout stress concentrations and remaining stone strips need a separate check.

m = A × t × ρ = 0.5281 × 0.030 × 2,400 = 38.03 kg
W = m × 9.81 = 373.04 N
Assumed end support lines: x = 0 and L = 0.9398 m
Gross-outline centre of mass x̄ = 0.4699 m
Illustrative additional point load P = 500 N at x = L/2
R₂ = (W × x̄ + P × L/2) ÷ L = 436.52 N
R₁ = W + P − R₂ = 436.52 N
Check: R₁ + R₂ = W + P = 873.04 N

500 N, where included, is an example load (about a 51 kg mass equivalent), not a prescribed residential design load. Trim-strip examples use self-weight only. The end-line model is a statics exercise: it does not permit this stone to span the full length. Actual rails, cutouts and supports can create a different load distribution.

Joint demand and support strength

If the right edge is a supported butt seam, this piece contributes 436.5 N to its support in the assumed load case. Add the adjoining piece’s edge reaction and applicable loads before selecting that support. No actual seam position or adjoining load is confirmed.

Capacity pending: stone bending and deflection, local bearing, support stiffness, joint shear/peel, connection capacity, load factors and the final design load combinations are not established. A bond area or an adhesive coupon strength alone cannot establish the installed joint’s capacity.

Upstairs double vanity End-support reactions · per piece
Upstairs double vanity · component-specific load-path diagram
Gross outline from project-5.jpg; support layout and orientation are scenario assumptions. Image shows one piece; source quantity is 1. Fixture openings are not reconstructed in this gross-outline model.

Gross area 1.2668 m²; thickness 30 mm (drawing reading); density 2,400 kg/m³ (Estimate · historical TCE family range). Openings are not deducted; cutout stress concentrations and remaining stone strips need a separate check.

m = A × t × ρ = 1.2668 × 0.030 × 2,400 = 91.21 kg
W = m × 9.81 = 894.79 N
Assumed end support lines: x = 0 and L = 2.2542 m
Gross-outline centre of mass x̄ = 1.1271 m
Illustrative additional point load P = 500 N at x = L/2
R₂ = (W × x̄ + P × L/2) ÷ L = 697.39 N
R₁ = W + P − R₂ = 697.39 N
Check: R₁ + R₂ = W + P = 1,394.79 N

500 N, where included, is an example load (about a 51 kg mass equivalent), not a prescribed residential design load. Trim-strip examples use self-weight only. The end-line model is a statics exercise: it does not permit this stone to span the full length. Actual rails, cutouts and supports can create a different load distribution.

Joint demand and support strength

If the right edge is a supported butt seam, this piece contributes 697.4 N to its support in the assumed load case. Add the adjoining piece’s edge reaction and applicable loads before selecting that support. No actual seam position or adjoining load is confirmed.

Capacity pending: stone bending and deflection, local bearing, support stiffness, joint shear/peel, connection capacity, load factors and the final design load combinations are not established. A bond area or an adhesive coupon strength alone cannot establish the installed joint’s capacity.

Upstairs desk End-support reactions · per piece
Upstairs desk · component-specific load-path diagram
Gross outline from project-5.jpg; support layout and orientation are scenario assumptions. Image shows one piece; source quantity is 1. Fixture openings are not reconstructed in this gross-outline model.

Gross area 0.4193 m²; thickness 30 mm (drawing reading); density 2,400 kg/m³ (Estimate · historical TCE family range). Openings are not deducted; cutout stress concentrations and remaining stone strips need a separate check.

m = A × t × ρ = 0.4193 × 0.030 × 2,400 = 30.19 kg
W = m × 9.81 = 296.16 N
Assumed end support lines: x = 0 and L = 0.7461 m
Gross-outline centre of mass x̄ = 0.3731 m
Illustrative additional point load P = 500 N at x = L/2
R₂ = (W × x̄ + P × L/2) ÷ L = 398.08 N
R₁ = W + P − R₂ = 398.08 N
Check: R₁ + R₂ = W + P = 796.16 N

500 N, where included, is an example load (about a 51 kg mass equivalent), not a prescribed residential design load. Trim-strip examples use self-weight only. The end-line model is a statics exercise: it does not permit this stone to span the full length. Actual rails, cutouts and supports can create a different load distribution.

Joint demand and support strength

If the right edge is a supported butt seam, this piece contributes 398.1 N to its support in the assumed load case. Add the adjoining piece’s edge reaction and applicable loads before selecting that support. No actual seam position or adjoining load is confirmed.

Capacity pending: stone bending and deflection, local bearing, support stiffness, joint shear/peel, connection capacity, load factors and the final design load combinations are not established. A bond area or an adhesive coupon strength alone cannot establish the installed joint’s capacity.

Basement detached cooktop-side counter End-support reactions · per piece
Basement detached cooktop-side counter · component-specific load-path diagram
Gross outline from project-5.jpg; support layout and orientation are scenario assumptions. Image shows one piece; source quantity is 1. Fixture openings are not reconstructed in this gross-outline model.

Gross area 0.4822 m²; thickness 30 mm (drawing reading); density 2,400 kg/m³ (Estimate · comparable quartz). Openings are not deducted; cutout stress concentrations and remaining stone strips need a separate check.

m = A × t × ρ = 0.4822 × 0.030 × 2,400 = 34.72 kg
W = m × 9.81 = 340.61 N
Assumed end support lines: x = 0 and L = 0.6382 m
Gross-outline centre of mass x̄ = 0.3191 m
Illustrative additional point load P = 500 N at x = L/2
R₂ = (W × x̄ + P × L/2) ÷ L = 420.31 N
R₁ = W + P − R₂ = 420.31 N
Check: R₁ + R₂ = W + P = 840.61 N

500 N, where included, is an example load (about a 51 kg mass equivalent), not a prescribed residential design load. Trim-strip examples use self-weight only. The end-line model is a statics exercise: it does not permit this stone to span the full length. Actual rails, cutouts and supports can create a different load distribution.

Joint demand and support strength

If the right edge is a supported butt seam, this piece contributes 420.3 N to its support in the assumed load case. Add the adjoining piece’s edge reaction and applicable loads before selecting that support. No actual seam position or adjoining load is confirmed.

Capacity pending: stone bending and deflection, local bearing, support stiffness, joint shear/peel, connection capacity, load factors and the final design load combinations are not established. A bond area or an adhesive coupon strength alone cannot establish the installed joint’s capacity.

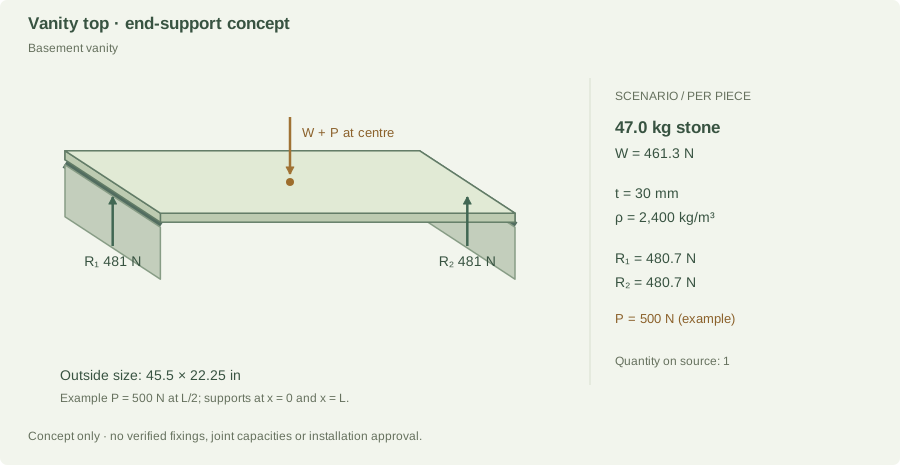
Basement vanity End-support reactions · per piece
Basement vanity · component-specific load-path diagram
Gross outline from project-5.jpg; support layout and orientation are scenario assumptions. Image shows one piece; source quantity is 1. Fixture openings are not reconstructed in this gross-outline model.

Gross area 0.6531 m²; thickness 30 mm (drawing reading); density 2,400 kg/m³ (Estimate · comparable quartz). Openings are not deducted; cutout stress concentrations and remaining stone strips need a separate check.

m = A × t × ρ = 0.6531 × 0.030 × 2,400 = 47.03 kg
W = m × 9.81 = 461.33 N
Assumed end support lines: x = 0 and L = 1.1557 m
Gross-outline centre of mass x̄ = 0.5778 m
Illustrative additional point load P = 500 N at x = L/2
R₂ = (W × x̄ + P × L/2) ÷ L = 480.66 N
R₁ = W + P − R₂ = 480.66 N
Check: R₁ + R₂ = W + P = 961.33 N

500 N, where included, is an example load (about a 51 kg mass equivalent), not a prescribed residential design load. Trim-strip examples use self-weight only. The end-line model is a statics exercise: it does not permit this stone to span the full length. Actual rails, cutouts and supports can create a different load distribution.

Joint demand and support strength

If the right edge is a supported butt seam, this piece contributes 480.7 N to its support in the assumed load case. Add the adjoining piece’s edge reaction and applicable loads before selecting that support. No actual seam position or adjoining load is confirmed.

Capacity pending: stone bending and deflection, local bearing, support stiffness, joint shear/peel, connection capacity, load factors and the final design load combinations are not established. A bond area or an adhesive coupon strength alone cannot establish the installed joint’s capacity.

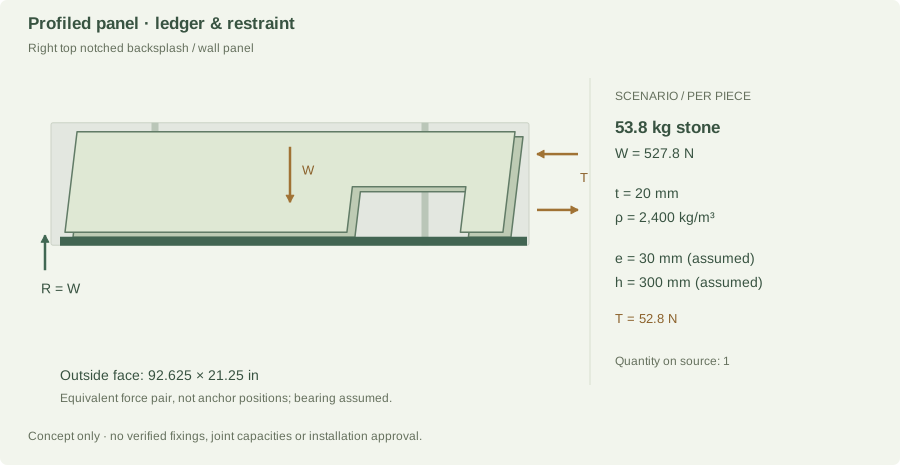
Right top notched backsplash / wall panel Panel load path · per piece
Right top notched backsplash / wall panel · component-specific load-path diagram
Gross outline from project-5.jpg; support layout and orientation are scenario assumptions. Image shows one piece; source quantity is 1. Fixture openings are not reconstructed in this gross-outline model.

Gross area 1.1208 m²; thickness 20 mm (20 mm scenario assumption; thickness not on the paper); density 2,400 kg/m³ (Assumed quartz arithmetic scenario; material identity unconfirmed). Openings are not deducted; cutout stress concentrations and remaining stone strips need a separate check.

m = A × t × ρ = 1.1208 × 0.020 × 2,400 = 53.80 kg
W = m × 9.81 = 527.77 N
Lower bearing demand R = W = 527.8 N
Assumed offset e = 0.030 m; restraint separation h = 0.3000 m
M = W × e = 15.83 N·m
T = M ÷ h = 52.78 N

The assumed separation is the smaller of 300 mm and 60% of the panel’s short outside dimension. This keeps the example couple within its outline; it does not establish anchor placement or edge clearances. The forces form an idealized upper-restraint/lower-bearing couple for one panel. They are not individual anchor capacities. Anchor prying, shared load, substrate strength and lateral/seismic loads are unassigned.

Joint demand and support strength

The bottom joint or ledger must transfer at least the 527.8 N modeled gravity demand from this panel, plus other applicable design actions. Adhesive-only suspension is not assumed.

Capacity pending: stone bending and deflection, local bearing, support stiffness, joint shear/peel, connection capacity, load factors and the final design load combinations are not established. A bond area or an adhesive coupon strength alone cannot establish the installed joint’s capacity.

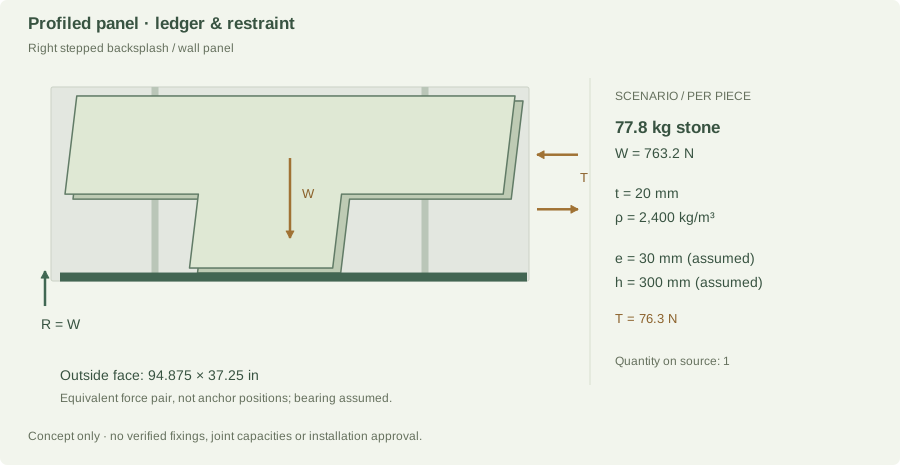
Right stepped backsplash / wall panel Panel load path · per piece
Right stepped backsplash / wall panel · component-specific load-path diagram
Gross outline from project-5.jpg; support layout and orientation are scenario assumptions. Image shows one piece; source quantity is 1. Fixture openings are not reconstructed in this gross-outline model.

Gross area 1.6207 m²; thickness 20 mm (20 mm scenario assumption; thickness not on the paper); density 2,400 kg/m³ (Assumed quartz arithmetic scenario; material identity unconfirmed). Openings are not deducted; cutout stress concentrations and remaining stone strips need a separate check.

m = A × t × ρ = 1.6207 × 0.020 × 2,400 = 77.79 kg
W = m × 9.81 = 763.16 N
Lower bearing demand R = W = 763.2 N
Assumed offset e = 0.030 m; restraint separation h = 0.3000 m
M = W × e = 22.89 N·m
T = M ÷ h = 76.32 N

The assumed separation is the smaller of 300 mm and 60% of the panel’s short outside dimension. This keeps the example couple within its outline; it does not establish anchor placement or edge clearances. The forces form an idealized upper-restraint/lower-bearing couple for one panel. They are not individual anchor capacities. Anchor prying, shared load, substrate strength and lateral/seismic loads are unassigned.

Joint demand and support strength

The bottom joint or ledger must transfer at least the 763.2 N modeled gravity demand from this panel, plus other applicable design actions. Adhesive-only suspension is not assumed.

Capacity pending: stone bending and deflection, local bearing, support stiffness, joint shear/peel, connection capacity, load factors and the final design load combinations are not established. A bond area or an adhesive coupon strength alone cannot establish the installed joint’s capacity.

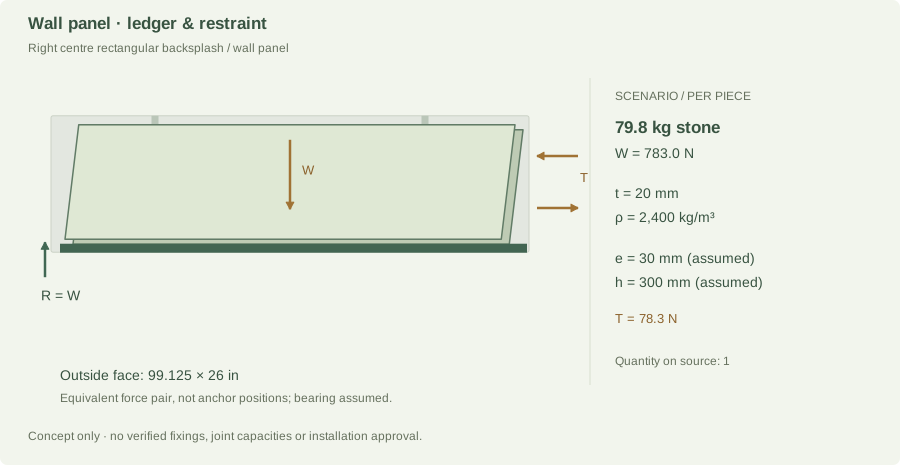
Right centre rectangular backsplash / wall panel Panel load path · per piece
Right centre rectangular backsplash / wall panel · component-specific load-path diagram
Gross outline from project-5.jpg; support layout and orientation are scenario assumptions. Image shows one piece; source quantity is 1. Fixture openings are not reconstructed in this gross-outline model.

Gross area 1.6627 m²; thickness 20 mm (20 mm scenario assumption; thickness not on the paper); density 2,400 kg/m³ (Assumed quartz arithmetic scenario; material identity unconfirmed). Openings are not deducted; cutout stress concentrations and remaining stone strips need a separate check.

m = A × t × ρ = 1.6627 × 0.020 × 2,400 = 79.81 kg
W = m × 9.81 = 782.95 N
Lower bearing demand R = W = 783.0 N
Assumed offset e = 0.030 m; restraint separation h = 0.3000 m
M = W × e = 23.49 N·m
T = M ÷ h = 78.30 N

The assumed separation is the smaller of 300 mm and 60% of the panel’s short outside dimension. This keeps the example couple within its outline; it does not establish anchor placement or edge clearances. The forces form an idealized upper-restraint/lower-bearing couple for one panel. They are not individual anchor capacities. Anchor prying, shared load, substrate strength and lateral/seismic loads are unassigned.

Joint demand and support strength

The bottom joint or ledger must transfer at least the 783.0 N modeled gravity demand from this panel, plus other applicable design actions. Adhesive-only suspension is not assumed.

Capacity pending: stone bending and deflection, local bearing, support stiffness, joint shear/peel, connection capacity, load factors and the final design load combinations are not established. A bond area or an adhesive coupon strength alone cannot establish the installed joint’s capacity.

Right lower wide panel Panel load path · per piece
Right lower wide panel · component-specific load-path diagram
Gross outline from project-5.jpg; support layout and orientation are scenario assumptions. Image shows one piece; source quantity is 1. Fixture openings are not reconstructed in this gross-outline model.

Gross area 0.8346 m²; thickness 20 mm (20 mm scenario assumption; thickness not on the paper); density 2,400 kg/m³ (Assumed quartz arithmetic scenario; material identity unconfirmed). Openings are not deducted; cutout stress concentrations and remaining stone strips need a separate check.

m = A × t × ρ = 0.8346 × 0.020 × 2,400 = 40.06 kg
W = m × 9.81 = 392.98 N
Lower bearing demand R = W = 393.0 N
Assumed offset e = 0.030 m; restraint separation h = 0.3000 m
M = W × e = 11.79 N·m
T = M ÷ h = 39.30 N

The assumed separation is the smaller of 300 mm and 60% of the panel’s short outside dimension. This keeps the example couple within its outline; it does not establish anchor placement or edge clearances. The forces form an idealized upper-restraint/lower-bearing couple for one panel. They are not individual anchor capacities. Anchor prying, shared load, substrate strength and lateral/seismic loads are unassigned.

Joint demand and support strength

The bottom joint or ledger must transfer at least the 393.0 N modeled gravity demand from this panel, plus other applicable design actions. Adhesive-only suspension is not assumed.

Capacity pending: stone bending and deflection, local bearing, support stiffness, joint shear/peel, connection capacity, load factors and the final design load combinations are not established. A bond area or an adhesive coupon strength alone cannot establish the installed joint’s capacity.

Right lower small panel Panel load path · per piece
Right lower small panel · component-specific load-path diagram
Gross outline from project-5.jpg; support layout and orientation are scenario assumptions. Image shows one piece; source quantity is 1. Fixture openings are not reconstructed in this gross-outline model.

Gross area 0.3322 m²; thickness 20 mm (20 mm scenario assumption; thickness not on the paper); density 2,400 kg/m³ (Assumed quartz arithmetic scenario; material identity unconfirmed). Openings are not deducted; cutout stress concentrations and remaining stone strips need a separate check.

m = A × t × ρ = 0.3322 × 0.020 × 2,400 = 15.95 kg
W = m × 9.81 = 156.43 N
Lower bearing demand R = W = 156.4 N
Assumed offset e = 0.030 m; restraint separation h = 0.3000 m
M = W × e = 4.69 N·m
T = M ÷ h = 15.64 N

The assumed separation is the smaller of 300 mm and 60% of the panel’s short outside dimension. This keeps the example couple within its outline; it does not establish anchor placement or edge clearances. The forces form an idealized upper-restraint/lower-bearing couple for one panel. They are not individual anchor capacities. Anchor prying, shared load, substrate strength and lateral/seismic loads are unassigned.

Joint demand and support strength

The bottom joint or ledger must transfer at least the 156.4 N modeled gravity demand from this panel, plus other applicable design actions. Adhesive-only suspension is not assumed.

Capacity pending: stone bending and deflection, local bearing, support stiffness, joint shear/peel, connection capacity, load factors and the final design load combinations are not established. A bond area or an adhesive coupon strength alone cannot establish the installed joint’s capacity.

Pair of small backsplash / wall strips Panel load path · per piece
Pair of small backsplash / wall strips · component-specific load-path diagram
Gross outline from project-5.jpg; support layout and orientation are scenario assumptions. Image shows one piece; source quantity is 2. Fixture openings are not reconstructed in this gross-outline model.

Gross area 0.0237 m²; thickness 20 mm (20 mm scenario assumption; thickness not on the paper); density 2,400 kg/m³ (Assumed quartz arithmetic scenario; material identity unconfirmed). Openings are not deducted; cutout stress concentrations and remaining stone strips need a separate check.

m = A × t × ρ = 0.0237 × 0.020 × 2,400 = 1.14 kg
W = m × 9.81 = 11.18 N
Lower bearing demand R = W = 11.2 N
Assumed offset e = 0.030 m; restraint separation h = 0.0591 m
M = W × e = 0.34 N·m
T = M ÷ h = 5.68 N

The assumed separation is the smaller of 300 mm and 60% of the panel’s short outside dimension. This keeps the example couple within its outline; it does not establish anchor placement or edge clearances. The forces form an idealized upper-restraint/lower-bearing couple for one panel. They are not individual anchor capacities. Anchor prying, shared load, substrate strength and lateral/seismic loads are unassigned.

Joint demand and support strength

The bottom joint or ledger must transfer at least the 11.2 N modeled gravity demand from this panel, plus other applicable design actions. Adhesive-only suspension is not assumed.

Capacity pending: stone bending and deflection, local bearing, support stiffness, joint shear/peel, connection capacity, load factors and the final design load combinations are not established. A bond area or an adhesive coupon strength alone cannot establish the installed joint’s capacity.

Bottom right backsplash / wall strip Panel load path · per piece
Bottom right backsplash / wall strip · component-specific load-path diagram
Gross outline from project-5.jpg; support layout and orientation are scenario assumptions. Image shows one piece; source quantity is 1. Fixture openings are not reconstructed in this gross-outline model.

Gross area 0.1152 m²; thickness 20 mm (20 mm scenario assumption; thickness not on the paper); density 2,400 kg/m³ (Assumed quartz arithmetic scenario; material identity unconfirmed). Openings are not deducted; cutout stress concentrations and remaining stone strips need a separate check.

m = A × t × ρ = 0.1152 × 0.020 × 2,400 = 5.53 kg
W = m × 9.81 = 54.23 N
Lower bearing demand R = W = 54.2 N
Assumed offset e = 0.030 m; restraint separation h = 0.0800 m
M = W × e = 1.63 N·m
T = M ÷ h = 20.33 N

The assumed separation is the smaller of 300 mm and 60% of the panel’s short outside dimension. This keeps the example couple within its outline; it does not establish anchor placement or edge clearances. The forces form an idealized upper-restraint/lower-bearing couple for one panel. They are not individual anchor capacities. Anchor prying, shared load, substrate strength and lateral/seismic loads are unassigned.

Joint demand and support strength

The bottom joint or ledger must transfer at least the 54.2 N modeled gravity demand from this panel, plus other applicable design actions. Adhesive-only suspension is not assumed.

Capacity pending: stone bending and deflection, local bearing, support stiffness, joint shear/peel, connection capacity, load factors and the final design load combinations are not established. A bond area or an adhesive coupon strength alone cannot establish the installed joint’s capacity.

A real bracket, in a separate example bay.

This example uses TCE4047 at 20 mm and 2,400 kg/m³. It does not claim this overhang exists in Project 05. A 350 mm overhang, 400 mm tributary width and 500 N tip load are deliberately assumed.

Calculated load demands

W_bay = ρ × t × 0.400 × 0.350 × 9.81 = 65.92 N
V = W_bay + 500 = 565.92 N
M_root = W_bay × 0.350/2 + 500 × 0.350
= 186.54 N·m
For a separate ideal connection with h = 0.150 m:
T_couple = M_root ÷ h = 1,243.58 N

The 150 mm force-couple lever arm is an algebra example for a vertically separated connection. It is not the Liberty’s flush-mounted lag-screw geometry or an anchor specification.

Federal Brace Liberty · SKU 30247

Published carry reference: 375 lbf per bracket ≈ 1,668 N. The bracket has a 12 in support projection plus 4⅛ in mounting length, with a 3 in width and ¼ in steel thickness.

Its guide calls for double 2×4 knee-wall blocking tied into the floor, flush/level mounting and spacing no greater than 18 in (457 mm). The 400 mm example bay is within that spacing figure. The assumed 350 mm overhang extends about 45 mm beyond the 305 mm arm; permissible stone extension still needs confirmation.

Comparison, not approval: the calculated 566 N shear is 33.9% of the catalog force reference. The guide does not establish the actual anchor-group moment resistance, stone capacity, test load position or an applicable design safety factor. Those checks remain open.

Other support and joint references.

Sink Setter PW-104-P

A separate cabinet-supported sink cradle can keep sink and water loads off an adhesive seam. The manufacturer’s telescoping rail range is 25–47 in; no numeric capacity was verified. Confirm cabinet clear width, sink weight, contained water and rail capacity.

PW-99-P and PW-104-P installation instructions — Sink Setter ↗

Stone seams and adhesive

Prefer a defined bearing path below a seam. An unsupported miter can carry shear, bending and peel; average shear alone is insufficient. The adhesive, substrate, bond geometry, cure, durability and design resistance must match the actual joint.

For example, 3M DP420 Black publishes a 17 MPa aluminum lap-shear test after seven days at 23°C. That is not a stone-to-stone seam allowable, so it is not used to size these joints.

3M Scotch-Weld Epoxy AdhesiveDP420 Black — English-EU technical data ↗

What is needed to finish the strength check?

Required resistance must cover the governing design demand on a consistent load/resistance basis. These pages calculate selected service-load demands; they do not supply tested allowable capacities or a code-compliant design factor. Stone cracking, deflection and joint failure therefore remain unresolved.

Sources, scope and calculation record

Force balance and moments use algebra: ΣF = 0 and ΣM = 0. No calculus is required for these demand examples.

Manufacturer tables apply only within their stated products, thicknesses, regions and installation conditions. They are not copied into a universal allowable-span rule. Research checked 24 October 2026.

Download assumptions and calculation record ↓
Return to project measurements →